Aldehyde dehydrogenases (ALDHs) are NAD(P)+-dependent enzymes that detoxify aldehydes by oxidizing them to carboxylic acids. Nineteen ALDHs are present in humans, expressed in a variety of organelles and having different substrate preferences (1). ALDH1A1 is a cytosolic enzyme that preferentially oxidizes retinaldehyde to retinoic acid (2). ALDH1A1 is expressed in the epithelium of many organs, including brain, liver, testis, eye lens and cornea (3). ALDH1A1 is highly expressed in brain dopaminergic neurons, where it produces the retinoic acid required for their differentiation and development (4). The retinoic acid produced by ALDH1A1 is also important for the differentiation of hematopoietic stem cells (5). ALDH1A1 is a major enzyme in the oxidation of acetaldehyde, a toxic metabolite of ethanol (6).
Human Aldehyde Dehydrogenase 1-A1/ALDH1A1 Antibody (703410)
R&D Systems | Catalog # MAB5869

Key Product Details
Validated by
Knockout/Knockdown
Species Reactivity
Validated:
Human
Cited:
Human, Mouse
Applications
Validated:
Immunohistochemistry, Western Blot, Immunocytochemistry, Simple Western, CyTOF-reported
Cited:
Immunohistochemistry, Western Blot, Flow Cytometry
Label
Unconjugated
Antibody Source
Monoclonal Mouse IgG2B Clone # 703410
Loading...
Product Specifications
Immunogen
E. coli-derived recombinant human Aldehyde Dehydrogenase 1-A1/ALDH1-A1
Ser2-Ser501
Accession # P00352
Ser2-Ser501
Accession # P00352
Specificity
Detects human Aldehyde Dehydrogenase 1-A1/ALDH1-A1 in direct ELISAs and Western blots. In direct ELISAs, approximatly
Clonality
Monoclonal
Host
Mouse
Isotype
IgG2B
Scientific Data Images for Human Aldehyde Dehydrogenase 1-A1/ALDH1A1 Antibody (703410)
Aldehyde Dehydrogenase 1‑A1/ALDH1A1 in A549 Human Cell Line.
Aldehyde Dehydrogenase 1-A1/ALDH1A1 was detected in immersion fixed A549 human lung carcinoma cell line using Mouse Anti-Human Aldehyde Dehydrogenase 1-A1/ALDH1A1 Monoclonal Antibody (Catalog # MAB5869) at 10 µg/mL for 3 hours at room temperature. Cells were stained using the NorthernLights™ 557-conjugated Anti-Mouse IgG Secondary Antibody (red; Catalog # NL007) and counterstained with DAPI (blue). Specific staining was localized to cytoplasm. View our protocol for Fluorescent ICC Staining of Cells on Coverslips.
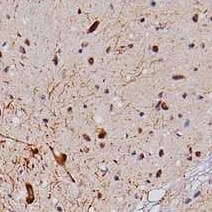
Aldehyde Dehydrogenase 1‑A1/ALDH1A1 in Human Brain.
Aldehyde Dehydrogenase 1-A1/ALDH1A1 was detected in immersion fixed paraffin-embedded sections of human brain (substantia nigra) using Mouse Anti-Human Aldehyde Dehydrogenase 1-A1/ALDH1A1 Monoclonal Antibody (Catalog # MAB5869) at 5 µg/mL overnight at 4 °C. Tissue was stained using the Anti-Mouse HRP-DAB Cell & Tissue Staining Kit (brown; Catalog # CTS002) and counterstained with hematoxylin (blue). Specific staining was localized to neurons. View our protocol for Chromogenic IHC Staining of Paraffin-embedded Tissue Sections.
Detection of Human Aldehyde Dehydrogenase 1‑A1/ALDH1A1 by Simple WesternTM.
Simple Western lane view shows lysates of human liver tissue, loaded at 0.2 mg/mL. A specific band was detected for Aldehyde Dehydrogenase 1‑A1/ALDH1A1 at approximately 58 kDa (as indicated) using 20 µg/mL of Mouse Anti-Human Aldehyde Dehydrogenase 1‑A1/ALDH1A1 Monoclonal Antibody (Catalog # MAB5869). This experiment was conducted under reducing conditions and using the 12-230 kDa separation system.
Detection of Human, Mouse, and Rat Aldehyde Dehydrogenase 1‑A1/ALDH1A1 by Western Blot.
Western blot shows lysates of human liver tissue, mouse liver tissue, and rat lung tissue. PVDF membrane was probed with 2 µg/mL of Mouse Anti-Human Aldehyde Dehydrogenase 1-A1/ALDH1A1 Monoclonal Antibody (Catalog # MAB5869) followed by HRP-conjugated Anti-Mouse IgG Secondary Antibody (Catalog # HAF007). A specific band was detected for Aldehyde Dehydrogenase 1-A1/ ALDH1A1 at approximately 54 kDa (as indicated). This experiment was conducted under reducing conditions and using Immunoblot Buffer Group 1.
Detection of Human Aldehyde Dehydrogenase 1-A1/ALDH1A1 by Western Blot
HTRA2 overexpression inhibitsDCIS.com breast cancer cell growth and invasion. (A–F) DCIS.com cells expressing pHAGE control or HTRA2 were analyzed for (A) ALDH1A1 and HTRA2 expression by immunoblot, (B) spheroid size in 3D cultures, (C) PCNA expression, (D) transwell invasion, (E) E-cadherin or (F) TWIST1 expression. Mean number of spheroids analyzed per group±s.e.m.: pHAGE, 325±25; pHAGE±CCL2, 358±33; HTRA2-OE, 343±17; HTRA2-OE±CCL2, 316±44. Protein levels in immunoblots were measured by densitometry. Expression levels were normalized to control group. Representative blots of three experiments are shown. Spheroid size and invasion index were normalized to spheroid number. Experimental groups were plated in triplicate. Experiments were performed three times. Two slides containing three sections each were subject to immunostaining. Statistical analysis was performed using two-tailed t-test (A) or one-way ANOVA with Bonferroni post-hoc comparison (B–F). *P<0.05, **P<0.01, ***P<0.001; n.s, not significant. Mean±s.e.m. is shown. Image collected and cropped by CiteAb from the following publication (https://pubmed.ncbi.nlm.nih.gov/31208996), licensed under a CC-BY license. Not internally tested by R&D Systems.
Detection of Human Aldehyde Dehydrogenase 1-A1/ALDH1A1 by Western Blot
HTRA2 overexpression orknockdown affects CCR2-H SUM225 and CCR2-KO DCIS.com breast cancer cell growth and invasion. (A–D) CCR2-H SUM225 cells expressing vehicle control (pHAGE) or HTRA2 (HTRA2-OE) were analyzed for HTRA2 expression by immunoblot (A), spheroid size in 3D cultures (B), PCNA expression (C) or invasion index (D). Mean number of spheroids analyzed per group±s.e.m.: pHAGE, 269±63; HTRA2-OE, 227±28. (E–H) CCR2-KO DCIS.com cells were transduced with lentivirus expressing Con or HTRA2 shRNAs (HTRA2-KD#2, HTRA2-KD#3) and analyzed for HTRA2 expression by immunoblot (E), spheroid size in Matrigel: Collagen (F), PCNA expression (G) or transwell invasion (H). Spheroid size and invasion index were normalized to spheroid number. Experimental groups were plated in triplicate. Experiments were repeated three times. Two slides containing three sections each were subject to immunostaining. Mean number of spheroids analyzed/group±s.e.m.: Con, 196±80; HTRA2-KD#2, 219±99; HTRA2-KD#2, 161±40. Statistical analysis was performed using two-tailed t-test (A–D) or one-way ANOVA with Bonferroni post-hoc comparison (E–H). *P<0.05, **P<0.01, ***P<0.001; n.s, not significant. Mean±s.e.m. is shown. Image collected and cropped by CiteAb from the following publication (https://pubmed.ncbi.nlm.nih.gov/31208996), licensed under a CC-BY license. Not internally tested by R&D Systems.
Detection of Human Aldehyde Dehydrogenase 1-A1/ALDH1A1 by Western Blot
Effect of p42/44MAPK and SMAD3 knockdown on CCL2/CCR2-mediated ALDH1A1 and HTRA2 expression. (A) DCIS.com, pHAGE or CCR2-H SUM225 cell lines were analyzed for expression of the indicated proteins by immunoblot. Arrow points to SMAD3 protein approximately 50 kda in size. (B) DCIS.com or CCR2-H SUM225 cells were transfected with control siRNAs or siRNAs to p42/44MAPK or SMAD3, stimulated with CCL2 for 24 h and analyzed for expression of the indicated proteins by immunoblot. Image collected and cropped by CiteAb from the following publication (https://pubmed.ncbi.nlm.nih.gov/31208996), licensed under a CC-BY license. Not internally tested by R&D Systems.
Detection of Human Aldehyde Dehydrogenase 1-A1/ALDH1A1 by Western Blot
HTRA2 overexpression orknockdown affects CCR2-H SUM225 and CCR2-KO DCIS.com breast cancer cell growth and invasion. (A–D) CCR2-H SUM225 cells expressing vehicle control (pHAGE) or HTRA2 (HTRA2-OE) were analyzed for HTRA2 expression by immunoblot (A), spheroid size in 3D cultures (B), PCNA expression (C) or invasion index (D). Mean number of spheroids analyzed per group±s.e.m.: pHAGE, 269±63; HTRA2-OE, 227±28. (E–H) CCR2-KO DCIS.com cells were transduced with lentivirus expressing Con or HTRA2 shRNAs (HTRA2-KD#2, HTRA2-KD#3) and analyzed for HTRA2 expression by immunoblot (E), spheroid size in Matrigel: Collagen (F), PCNA expression (G) or transwell invasion (H). Spheroid size and invasion index were normalized to spheroid number. Experimental groups were plated in triplicate. Experiments were repeated three times. Two slides containing three sections each were subject to immunostaining. Mean number of spheroids analyzed/group±s.e.m.: Con, 196±80; HTRA2-KD#2, 219±99; HTRA2-KD#2, 161±40. Statistical analysis was performed using two-tailed t-test (A–D) or one-way ANOVA with Bonferroni post-hoc comparison (E–H). *P<0.05, **P<0.01, ***P<0.001; n.s, not significant. Mean±s.e.m. is shown. Image collected and cropped by CiteAb from the following publication (https://pubmed.ncbi.nlm.nih.gov/31208996), licensed under a CC-BY license. Not internally tested by R&D Systems.
Detection of Human Aldehyde Dehydrogenase 1-A1/ALDH1A1 by Western Blot
ALDH1A1 knockdown inhibits DCIS.com breast cancer cell growth and invasion. (A–F) DCIS.com cells expressing control shRNAs (Con) or shRNAs to ALDH1A1 (ALDH-KD#1, ALDH-KD#5) were treated with/without 100 ng/ml CCL2 and analyzed for (A) ALDH1A1 and HTRA2 expression by immunoblot, (B) spheroid size in 3D cultures, (C) PCNA expression, (D) transwell invasion, (E) E-cadherin or (F) TWIST1 expression. Mean number of spheroids analyzed per group±s.e.m.: Con, 163+9; Con+CCL2, 165+7; ALDH-KD#1 152+12; ALDH-KD#1+CCL2, 168+11; ALDH-KD#5, 174+10; ALDH-KD#5+CCL2, 162+13. Protein levels in immunoblots were measured by densitometry. Expression levels were normalized to control group. Representative blots of three experiments are shown. Spheroid size and invasion index were normalized to spheroid number. Experimental groups were plated in triplicate. Experiments were performed three times. Two slides containing three sections each were subject to immunostaining. Statistical analysis was performed using one-way ANOVA with Bonferroni post-hoc comparison. *P<0.05, **P<0.01; n.s, not significant. Mean±s.e.m. is shown. Image collected and cropped by CiteAb from the following publication (https://pubmed.ncbi.nlm.nih.gov/31208996), licensed under a CC-BY license. Not internally tested by R&D Systems.
Detection of Human Aldehyde Dehydrogenase 1-A1/ALDH1A1 by Western Blot
ALDH1A1 overexpression orknockdown affects CCR2-H SUM225 and CCR2-KO DCIS.com breast cancer cell growth but not invasion. (A–D) CCR2-H SUM225 cells expressing Con shRNAs or shRNAs to ALDH1A1 (ALDH-KD#1, ALDH-KD#5) were analyzed for ALDH1A1 and HTRA2 expression by immunoblot (A), spheroid size in 3D cultures (B), PCNA expression (C) or invasion index (D). Mean number of spheroids analyzed per group±s.e.m.: Con, 197±18; ALDH-KD#1, 190±10; ALDH-KD#5, 196±87. (E–H) CCR2-KO DCIS.com cells expressing vehicle control (pHAGE) or ALDH1A1 (ALDH-OE) were analyzed for: expression of ALDH1A1 and HTRA2 by immunoblot (E), spheroid size in 3D cultures (F), PCNA expression (G) or transwell invasion (H). Protein levels in immunoblots were measured by densitometry. Expression levels were normalized to control group. Representative blots of three experiments are shown. Spheroid size and invasion index were normalized to spheroid number. Experimental groups were plated in triplicate. Experiments were performed three times. Two slides containing three sections each were subject to immunostaining. Mean number of spheroids analyzed per group±s.e.m.: pHAGE, 275±58; ALDH-OE, 219±38. Statistical analysis was performed using one-way ANOVA with Bonferroni post-hoc comparison. *P<0.05; n.s, not significant. Mean±s.e.m. is shown. Image collected and cropped by CiteAb from the following publication (https://pubmed.ncbi.nlm.nih.gov/31208996), licensed under a CC-BY license. Not internally tested by R&D Systems.
Detection of Human Aldehyde Dehydrogenase 1-A1/ALDH1A1 by Western Blot
ALDH1A1 overexpression orknockdown affects CCR2-H SUM225 and CCR2-KO DCIS.com breast cancer cell growth but not invasion. (A–D) CCR2-H SUM225 cells expressing Con shRNAs or shRNAs to ALDH1A1 (ALDH-KD#1, ALDH-KD#5) were analyzed for ALDH1A1 and HTRA2 expression by immunoblot (A), spheroid size in 3D cultures (B), PCNA expression (C) or invasion index (D). Mean number of spheroids analyzed per group±s.e.m.: Con, 197±18; ALDH-KD#1, 190±10; ALDH-KD#5, 196±87. (E–H) CCR2-KO DCIS.com cells expressing vehicle control (pHAGE) or ALDH1A1 (ALDH-OE) were analyzed for: expression of ALDH1A1 and HTRA2 by immunoblot (E), spheroid size in 3D cultures (F), PCNA expression (G) or transwell invasion (H). Protein levels in immunoblots were measured by densitometry. Expression levels were normalized to control group. Representative blots of three experiments are shown. Spheroid size and invasion index were normalized to spheroid number. Experimental groups were plated in triplicate. Experiments were performed three times. Two slides containing three sections each were subject to immunostaining. Mean number of spheroids analyzed per group±s.e.m.: pHAGE, 275±58; ALDH-OE, 219±38. Statistical analysis was performed using one-way ANOVA with Bonferroni post-hoc comparison. *P<0.05; n.s, not significant. Mean±s.e.m. is shown. Image collected and cropped by CiteAb from the following publication (https://pubmed.ncbi.nlm.nih.gov/31208996), licensed under a CC-BY license. Not internally tested by R&D Systems.Applications for Human Aldehyde Dehydrogenase 1-A1/ALDH1A1 Antibody (703410)
Application
Recommended Usage
CyTOF-reported
Brodie, T.M. et al. (2018) Cytometry Part
A. 93: 406. Ready to be labeled using established
conjugation methods. No BSA or other carrier proteins that could interfere with
conjugation.
Immunocytochemistry
8-25 µg/mL
Sample: Immersion fixed A549 human lung carcinoma cell line
Sample: Immersion fixed A549 human lung carcinoma cell line
Immunohistochemistry
8-25 µg/mL
Sample: Immersion fixed paraffin-embedded sections of human brain (substantia nigra)
Sample: Immersion fixed paraffin-embedded sections of human brain (substantia nigra)
Simple Western
20 µg/mL
Sample: Human liver tissue
Sample: Human liver tissue
Western Blot
2 µg/mL
Sample: Human liver tissue, mouse liver tissue, and rat lung tissue
Sample: Human liver tissue, mouse liver tissue, and rat lung tissue
Reviewed Applications
Read 1 review rated 5 using MAB5869 in the following applications:
Formulation, Preparation, and Storage
Purification
Protein A or G purified from hybridoma culture supernatant
Reconstitution
Sterile PBS to a final concentration of 0.5 mg/mL. For liquid material, refer to CoA for concentration.
Loading...
Formulation
Lyophilized from a 0.2 μm filtered solution in PBS with Trehalose. *Small pack size (SP) is supplied either lyophilized or as a 0.2 µm filtered solution in PBS.
Shipping
Lyophilized product is shipped at ambient temperature. Liquid small pack size (-SP) is shipped with polar packs. Upon receipt, store immediately at the temperature recommended below.
Stability & Storage
Use a manual defrost freezer and avoid repeated freeze-thaw cycles.
- 12 months from date of receipt, -20 to -70 °C as supplied.
- 1 month, 2 to 8 °C under sterile conditions after reconstitution.
- 6 months, -20 to -70 °C under sterile conditions after reconstitution.
Calculators
Background: Aldehyde Dehydrogenase 1-A1/ALDH1A1
References
- Zhao, D. et al. (1996) Eur. J. Biochem. 240:15.
- King, G. and Holmes, R. (1997) Adv. Exp. Med. Biol. 414:19.
- Jacobs, F.M. et al. (2007) Development 134:2673.
- Chute, J.P. et al. (2006) Proc. Natl. Acad. Sci. USA. 103:11707.
- Ueshima, Y. et al. (1993) Alcohol Alcohol. 1B:15.
Alternate Names
ALDC, Aldehyde Dehydrogenase 1A1, ALDH-E1, ALDH1A1, PUMB1, RALDH1
Entrez Gene IDs
216 (Human)
Gene Symbol
ALDH1A1
UniProt
Additional Aldehyde Dehydrogenase 1-A1/ALDH1A1 Products
- All Products for Aldehyde Dehydrogenase 1-A1/ALDH1A1
- Aldehyde Dehydrogenase 1-A1/ALDH1A1 cDNA Clones
- Aldehyde Dehydrogenase 1-A1/ALDH1A1 ELISA Kits
- Aldehyde Dehydrogenase 1-A1/ALDH1A1 Lysates
- Aldehyde Dehydrogenase 1-A1/ALDH1A1 Primary Antibodies
- Aldehyde Dehydrogenase 1-A1/ALDH1A1 Proteins and Enzymes
Product Documents for Human Aldehyde Dehydrogenase 1-A1/ALDH1A1 Antibody (703410)
Certificate of Analysis
To download a Certificate of Analysis, please enter a lot or batch number in the search box below.
Note: Certificate of Analysis not available for kit components.
Product Specific Notices for Human Aldehyde Dehydrogenase 1-A1/ALDH1A1 Antibody (703410)
For research use only
Related Research Areas
Citations for Human Aldehyde Dehydrogenase 1-A1/ALDH1A1 Antibody (703410)
 Powered by Bioz
Customer Reviews for Human Aldehyde Dehydrogenase 1-A1/ALDH1A1 Antibody (703410) (1)
5 out of 5
1 Customer Rating
Have you used Human Aldehyde Dehydrogenase 1-A1/ALDH1A1 Antibody (703410)?
Submit a review and receive an Amazon gift card!
$25/€18/£15/$25CAN/¥2500 Yen for a review with an image
$10/€7/£6/$10CAN/¥1110 Yen for a review without an image
Submit a review
Customer Images
Showing
1
-
1 of
1 review
Showing All
Filter By:
-
Application: ImmunohistochemistrySample Tested: Brain tissueSpecies: HumanVerified Customer | Posted 07/21/2022

There are no reviews that match your criteria.
Protocols
Find general support by application which include: protocols, troubleshooting, illustrated assays, videos and webinars.
- Antigen Retrieval Protocol (PIER)
- Antigen Retrieval for Frozen Sections Protocol
- Appropriate Fixation of IHC/ICC Samples
- Cellular Response to Hypoxia Protocols
- Chromogenic IHC Staining of Formalin-Fixed Paraffin-Embedded (FFPE) Tissue Protocol
- Chromogenic Immunohistochemistry Staining of Frozen Tissue
- ClariTSA™ Fluorophore Kits
- Detection & Visualization of Antibody Binding
- Fluorescent IHC Staining of Frozen Tissue Protocol
- Graphic Protocol for Heat-induced Epitope Retrieval
- Graphic Protocol for the Preparation and Fluorescent IHC Staining of Frozen Tissue Sections
- Graphic Protocol for the Preparation and Fluorescent IHC Staining of Paraffin-embedded Tissue Sections
- Graphic Protocol for the Preparation of Gelatin-coated Slides for Histological Tissue Sections
- ICC Cell Smear Protocol for Suspension Cells
- ICC Immunocytochemistry Protocol Videos
- ICC for Adherent Cells
- IHC Sample Preparation (Frozen sections vs Paraffin)
- Immunocytochemistry (ICC) Protocol
- Immunocytochemistry Troubleshooting
- Immunofluorescence of Organoids Embedded in Cultrex Basement Membrane Extract
- Immunofluorescent IHC Staining of Formalin-Fixed Paraffin-Embedded (FFPE) Tissue Protocol
- Immunohistochemistry (IHC) and Immunocytochemistry (ICC) Protocols
- Immunohistochemistry Frozen Troubleshooting
- Immunohistochemistry Paraffin Troubleshooting
- Preparing Samples for IHC/ICC Experiments
- Preventing Non-Specific Staining (Non-Specific Binding)
- Primary Antibody Selection & Optimization
- Protocol for Heat-Induced Epitope Retrieval (HIER)
- Protocol for Making a 4% Formaldehyde Solution in PBS
- Protocol for VisUCyte™ HRP Polymer Detection Reagent
- Protocol for the Fluorescent ICC Staining of Cell Smears - Graphic
- Protocol for the Fluorescent ICC Staining of Cultured Cells on Coverslips - Graphic
- Protocol for the Preparation & Fixation of Cells on Coverslips
- Protocol for the Preparation and Chromogenic IHC Staining of Frozen Tissue Sections
- Protocol for the Preparation and Chromogenic IHC Staining of Frozen Tissue Sections - Graphic
- Protocol for the Preparation and Chromogenic IHC Staining of Paraffin-embedded Tissue Sections
- Protocol for the Preparation and Chromogenic IHC Staining of Paraffin-embedded Tissue Sections - Graphic
- Protocol for the Preparation and Fluorescent ICC Staining of Cells on Coverslips
- Protocol for the Preparation and Fluorescent ICC Staining of Non-adherent Cells
- Protocol for the Preparation and Fluorescent ICC Staining of Stem Cells on Coverslips
- Protocol for the Preparation and Fluorescent IHC Staining of Frozen Tissue Sections
- Protocol for the Preparation and Fluorescent IHC Staining of Paraffin-embedded Tissue Sections
- Protocol for the Preparation of Gelatin-coated Slides for Histological Tissue Sections
- Protocol for the Preparation of a Cell Smear for Non-adherent Cell ICC - Graphic
- R&D Systems Quality Control Western Blot Protocol
- TUNEL and Active Caspase-3 Detection by IHC/ICC Protocol
- The Importance of IHC/ICC Controls
- Troubleshooting Guide: Immunohistochemistry
- Troubleshooting Guide: Western Blot Figures
- Western Blot Conditions
- Western Blot Protocol
- Western Blot Protocol for Cell Lysates
- Western Blot Troubleshooting
- Western Blot Troubleshooting Guide
- View all Protocols, Troubleshooting, Illustrated assays and Webinars
Loading...