
Key Product Details
Validated by
Knockout/Knockdown, Biological Validation
Species Reactivity
Validated:
Human, Mouse, Rat
Cited:
Human, Mouse, Rat, Transgenic Mouse
Applications
Validated:
Knockout Validated, Immunohistochemistry, Western Blot, Immunocytochemistry, Simple Western, Immunoprecipitation
Cited:
Immunohistochemistry, Western Blot, Immunocytochemistry, Immunoprecipitation
Label
Unconjugated
Antibody Source
Monoclonal Mouse IgG1 Clone # 864807
Loading...
Product Specifications
Immunogen
E. coli-derived recombinant human p62/SQSTM1
Asp368-Leu440
Accession # Q13501
Asp368-Leu440
Accession # Q13501
Specificity
Detects human p62/SQSTM1 in ELISAs. Detects human, mouse and rat p62/SQSTM1 in Western blots
Clonality
Monoclonal
Host
Mouse
Isotype
IgG1
Scientific Data Images for p62/SQSTM1 Antibody (864807)
Detection of Human, Mouse, and Rat p62/SQSTM1 by Western Blot.
Western blot shows lysates of HeLa human cervical epithelial carcinoma cell line, RAW 264.7 mouse monocyte/macrophage cell line, and C6 rat glioma cell line untreated (-) or treated (+) with 1 µg/mL LPS for 24 hours. PVDF membrane was probed with 2 µg/mL of Mouse Anti-Human/Mouse/Rat p62/SQSTM1 Monoclonal Antibody (Catalog # MAB8028) followed by HRP-conjugated Anti-Mouse IgG Secondary Antibody (HAF018). A specific band was detected for p62/SQSTM1 at approximately 62 kDa (as indicated). This experiment was conducted under reducing conditions and using Immunoblot Buffer Group 1.
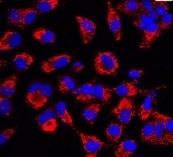
p62/SQSTM1 in HeLa Human Cell Line.
p62/SQSTM1 was detected in immersion fixed HeLa human cervical epithelial carcinoma cell line using Mouse Anti-Human/Mouse/Rat p62/SQSTM1 Monoclonal Antibody (Catalog # MAB8028) at 25 µg/mL for 3 hours at room temperature. Cells were stained using the NorthernLights™ 557-conjugated Anti-Mouse IgG Secondary Antibody (red; NL007) and counterstained with DAPI (blue). Specific staining was localized to phagosomes in cell cytoplasm. View our protocol for Fluorescent ICC Staining of Cells on Coverslips.
p62/SQSTM1 in Human Liver.
p62/SQSTM1 was detected in immersion fixed paraffin-embedded sections of human liver using Mouse Anti-Human/Mouse/Rat p62/SQSTM1 Monoclonal Antibody (Catalog # MAB8028) at 5 µg/mL for 1 hour at room temperature followed by incubation with the Anti-Mouse IgG VisUCyte™ HRP Polymer Antibody (VC001). Before incubation with the primary antibody, tissue was subjected to heat-induced epitope retrieval using Antigen Retrieval Reagent-Basic (CTS013). Tissue was stained using DAB (brown) and counterstained with hematoxylin (blue). Specific staining was localized to nuclei and cytoplasm in hepatocytes. Staining was performed using our protocol for IHC Staining with VisUCyte HRP Polymer Detection Reagents.
Detection of Mouse p62/SQSTM1 by Simple WesternTM.
Simple Western lane view shows lysates of RAW 264.7 mouse monocyte/macrophage cell line untreated (-) or treated (+) with 1 µg/mL LPS for 24 hours, loaded at 0.2 mg/mL. A specific band was detected for p62/SQSTM1 at approximately 66 kDa (as indicated) using 20 µg/mL of Mouse Anti-Human/Mouse/Rat p62/SQSTM1 Monoclonal Antibody (Catalog # MAB8028). This experiment was conducted under reducing conditions and using the 12-230 kDa separation system.
p62/SQSTM1 Specificity is Shown by Immunocytochemistry in Knockout Cell Line.
p62/SQSTM1 was detected in immersion fixed HeLa human cervical epithelial carcinoma cell line but is not detected in p62/SQSTM1 knockout (KO) HeLa cell line using Mouse Anti-Human/Mouse/Rat p62/SQSTM1 Monoclonal Antibody (Catalog # MAB8028) at 3 µg/mL for 3 hours at room temperature. Cells were stained using the NorthernLights™ 557-conjugated Anti-Mouse IgG Secondary Antibody (red; NL007) and counterstained with DAPI (blue). Specific staining was localized to cytoplasm. View our protocol for Fluorescent ICC Staining of Cells on Coverslips.
Western Blot Shows Human p62/SQSTM1 Specificity Using Knockout Cell Line.
Western blot shows lysates of HeLa human cervical epithelial carcinoma parental cell line and p62/SQSTM1 knockout HeLa cell line (KO). PVDF membrane was probed with 2 µg/mL of Mouse Anti-Human/Mouse/Rat p62/SQSTM1 Monoclonal Antibody (Catalog # MAB8028) followed by HRP-conjugated Anti-Mouse IgG Secondary Antibody (HAF018). A specific band was detected for p62/SQSTM1 at approximately 62 kDa (as indicated) in the parental HeLa cell line, but is not detectable in the knockout HeLa cell line. GAPDH (MAB5718) is shown as a loading control. This experiment was conducted under reducing conditions and using Immunoblot Buffer Group 1.
Detection of Human p62/SQSTM1 by Western Blot
The combination of BRZ and TMZ increased cell death in GBM stem-like cells by activating autophagy (A,B) Autophagy marker LC3 immunostaining of U251_Ctrl and U251_CA2 cells after TMZ and ACZ/BRZ stimulation for 24 h. Co-treatment with TMZ and BRZ induced the expression of LC3 puncta in U251_CA2 cells (scale bar: 50 μm). (C,D) Western Blotting of autophagy-related proteins and CA2 protein in U251_Ctrl and U251_CA2 cells with the same treatment as in (A). TMZ plus BRZ did not increase the protein expression of LC3II in U251_Ctrl cells compared to TMZ treatment alone (C) but increased in U251_CA2 cells (D) (n = 3). (E–G) Western Blotting of autophagy-related proteins and CA2 protein in GBM stem cells with the same treatment as in Figure 5E–G for 24 h stimulation. Compared with the control group, TMZ monotherapy has a tendency to increase the protein level of LC3II, but the expression of it is significantly increased in BRZ alone and TMZ combined with BRZ treatment (n = 3). Results were obtained from three independent experiments. Data are presented as mean ± SEM, One-way ANOVA was used to analyze the data, * p < 0.05; ** p < 0.01; *** p < 0.001, ns: not significant. Image collected and cropped by CiteAb from the following open publication (https://pubmed.ncbi.nlm.nih.gov/35008590), licensed under a CC-BY license. Not internally tested by R&D Systems.
Western Blot Shows Human p62/SQSTM1 Specificity Using Knockout Cell Line.
Western blot shows lysates of U2OS human osteosarcoma cell line and p62/SQSTM1 knockout U2OS cell line (KO). Nitrocellulose membrane was probed with 0.5 µg/mL of Mouse Anti-Human/Mouse/Rat p62/SQSTM1 Monoclonal Antibody (Catalog # MAB8028) followed by HRP-conjugated Anti-Mouse IgG Secondary Antibody. A specific band was detected for p62/SQSTM1 at approximately 62 kDa (as indicated) in the parental U2OS cell line, but is not detectable in knockout U2OS cell line. The Ponceau stained transfer of the blot is shown. This experiment was conducted under reducing conditions. Image, protocol, and testing courtesy of YCharOS Inc. See ycharos.com for additional details.
Detection of Human p62/SQSTM1 by Western Blot
The combination of BRZ and TMZ increased cell death in GBM stem-like cells by activating autophagy (A,B) Autophagy marker LC3 immunostaining of U251_Ctrl and U251_CA2 cells after TMZ and ACZ/BRZ stimulation for 24 h. Co-treatment with TMZ and BRZ induced the expression of LC3 puncta in U251_CA2 cells (scale bar: 50 μm). (C,D) Western Blotting of autophagy-related proteins and CA2 protein in U251_Ctrl and U251_CA2 cells with the same treatment as in (A). TMZ plus BRZ did not increase the protein expression of LC3II in U251_Ctrl cells compared to TMZ treatment alone (C) but increased in U251_CA2 cells (D) (n = 3). (E–G) Western Blotting of autophagy-related proteins and CA2 protein in GBM stem cells with the same treatment as in Figure 5E–G for 24 h stimulation. Compared with the control group, TMZ monotherapy has a tendency to increase the protein level of LC3II, but the expression of it is significantly increased in BRZ alone and TMZ combined with BRZ treatment (n = 3). Results were obtained from three independent experiments. Data are presented as mean ± SEM, One-way ANOVA was used to analyze the data, * p < 0.05; ** p < 0.01; *** p < 0.001, ns: not significant. Image collected and cropped by CiteAb from the following open publication (https://pubmed.ncbi.nlm.nih.gov/35008590), licensed under a CC-BY license. Not internally tested by R&D Systems.
Detection of SQSTM1/p62 by Immunoprecipitation
Immunoprecipitation was performed on cell lysate of U2OS human osteosarcoma cell line using 1.0 μg of Mouse Anti-Human SQSTM1/p62 Monoclonal Antibody (Catalog # MAB8028) pre-coupled to protein G or protein A beads. Immunoprecipitated SQSTM1/p62 was detected with Rabbit Anti-SQSTM1/p62 Monoclonal Antibody (Catalog # MAB80281). The Ponceau stained transfers of each blot are shown. SM=10% starting material; UB=10% unbound fraction; IP=immunoprecipitated. Image, protocol, and testing courtesy of YCharOS Inc. (ycharos.com).
Detection of Human p62/SQSTM1 by Western Blot
The combination of BRZ and TMZ increased cell death in GBM stem-like cells by activating autophagy (A,B) Autophagy marker LC3 immunostaining of U251_Ctrl and U251_CA2 cells after TMZ and ACZ/BRZ stimulation for 24 h. Co-treatment with TMZ and BRZ induced the expression of LC3 puncta in U251_CA2 cells (scale bar: 50 μm). (C,D) Western Blotting of autophagy-related proteins and CA2 protein in U251_Ctrl and U251_CA2 cells with the same treatment as in (A). TMZ plus BRZ did not increase the protein expression of LC3II in U251_Ctrl cells compared to TMZ treatment alone (C) but increased in U251_CA2 cells (D) (n = 3). (E–G) Western Blotting of autophagy-related proteins and CA2 protein in GBM stem cells with the same treatment as in Figure 5E–G for 24 h stimulation. Compared with the control group, TMZ monotherapy has a tendency to increase the protein level of LC3II, but the expression of it is significantly increased in BRZ alone and TMZ combined with BRZ treatment (n = 3). Results were obtained from three independent experiments. Data are presented as mean ± SEM, One-way ANOVA was used to analyze the data, * p < 0.05; ** p < 0.01; *** p < 0.001, ns: not significant. Image collected and cropped by CiteAb from the following open publication (https://pubmed.ncbi.nlm.nih.gov/35008590), licensed under a CC-BY license. Not internally tested by R&D Systems.
Detection of p62/SQSTM1 by Western Blot
CSE induces autophagy in ASMCs. (A) Representative Western blots and image analysis of CSE-induced p62, beclin-1, and LC3A/B protein expression. GAPDH served as reference protein and p < 0.05 was considered significant. (B) Representative confocal microscopy on mitochondria-LC3 co-localization (white arrow) after CSE-stimulation (60×, green: cytochrome C, red: LC3A/B, blue: DAPI). Statistics were calculated by Mann–Whitney U-test. Image collected and cropped by CiteAb from the following open publication (https://pubmed.ncbi.nlm.nih.gov/36430467), licensed under a CC-BY license. Not internally tested by R&D Systems.
Detection of p62/SQSTM1 by Western Blot
MDP reduces intestinal barrier damage and activates autophagy in vitro. (A) Schematic diagram of the administration of MDP (0, 1, 5, 10 μg/ml, respectively) in Caco-2 cells. (B) Western blotting analysis for NOD2, LC3 І, and LC3 ІІ with GAPDH as the internal standard protein in Caco-2 cells. Representative images of the immune blotting were shown. (C,D) Quantification of the relative expression of NOD2 and LC3 ІІ in panel (B) by ImageJ, respectively. Results were from three independent experiments. (E) Cytotoxicity of Caco-2 cells with the administration of with LPS (0, 1, 10, 100 μg/mL, respectively) for 24 h by testing LDH OD value. (F) Relative RNA levels of IL-1 beta of Caco-2 cells with the administration of LPS. (G) Western blotting analysis for ZO-1, p62, and LC3 ІІ with GAPDH as the internal standard protein in Caco-2 cells of the groups (Control, MDP, LPS, and LPS + MDP), respectively. Representative images of three duplicate samples of the immune blotting were shown. (H–J) Quantification of the relative expression of ZO-1, p62, and LC3 ІІ in panel (G) by ImageJ, respectively. (K) Cytotoxicity of Caco-2 cells of the groups (Control, MDP, LPS, and LPS + MDP) by testing LDH OD value. Data were expressed as mean ± SEM. *p <0.05, **p <0.01, ns, not significant, One-way ANOVA. Image collected and cropped by CiteAb from the following open publication (https://pubmed.ncbi.nlm.nih.gov/36506547), licensed under a CC-BY license. Not internally tested by R&D Systems.
Detection of p62/SQSTM1 by Western Blot
MDP activates autophagy in colon of DSS-induced mice. (A) Western blotting analysis for p62, LC3 І, and LC3 ІІ with beta -Actin as the internal standard protein in the colon of PBS, MDP, DSS + PBS, and DSS + MDP group mice. Representative images of three duplicate samples of the immune blotting were shown. (B–D) Quantification of the relative expression of p62, LC3 І and LC3 ІІ in panel (A) by ImageJ, respectively. Data were expressed as mean ± SEM. *p <0.05, **p <0.01, ns, not significant, One-way ANOVA. Image collected and cropped by CiteAb from the following open publication (https://pubmed.ncbi.nlm.nih.gov/36506547), licensed under a CC-BY license. Not internally tested by R&D Systems.
Detection of p62/SQSTM1 by Western Blot
CSE modulates mitochondrial homeostasis by mitophagy and lysosome activity. (A) Representative Western blots and image analysis of p62, beclin-1, and LC3A/B protein of control and COPD ASMCs; GAPDH served as reference protein; p < 0.05 was considered significant. Statistics were calculated by Student’s t-test. (B) Representative confocal microscopy of co-localization mitochondria-LC3 (60×, green: cytochrome C, red: LC3A/B, blue: DAPI, white arrow shows co-localization). (C) Representative Western blots and image analysis of EEA1 and LAMP-1 protein of control and COPD ASMCs; GAPDH was used as reference protein, p < 0.05 was considered significant. Statistics were calculated by Student’s t-test. (D), Representative confocal microscopy of mitochondria–lysosome co-localization (60×, red: TOMM20, green: LAMP1, blue: DAPI, white arrow shows co-localization. Image collected and cropped by CiteAb from the following open publication (https://pubmed.ncbi.nlm.nih.gov/36430467), licensed under a CC-BY license. Not internally tested by R&D Systems.
Detection of p62/SQSTM1 by Western Blot
MDP reduces intestinal barrier damage and activates autophagy in vitro. (A) Schematic diagram of the administration of MDP (0, 1, 5, 10 μg/ml, respectively) in Caco-2 cells. (B) Western blotting analysis for NOD2, LC3 І, and LC3 ІІ with GAPDH as the internal standard protein in Caco-2 cells. Representative images of the immune blotting were shown. (C,D) Quantification of the relative expression of NOD2 and LC3 ІІ in panel (B) by ImageJ, respectively. Results were from three independent experiments. (E) Cytotoxicity of Caco-2 cells with the administration of with LPS (0, 1, 10, 100 μg/mL, respectively) for 24 h by testing LDH OD value. (F) Relative RNA levels of IL-1 beta of Caco-2 cells with the administration of LPS. (G) Western blotting analysis for ZO-1, p62, and LC3 ІІ with GAPDH as the internal standard protein in Caco-2 cells of the groups (Control, MDP, LPS, and LPS + MDP), respectively. Representative images of three duplicate samples of the immune blotting were shown. (H–J) Quantification of the relative expression of ZO-1, p62, and LC3 ІІ in panel (G) by ImageJ, respectively. (K) Cytotoxicity of Caco-2 cells of the groups (Control, MDP, LPS, and LPS + MDP) by testing LDH OD value. Data were expressed as mean ± SEM. *p <0.05, **p <0.01, ns, not significant, One-way ANOVA. Image collected and cropped by CiteAb from the following open publication (https://pubmed.ncbi.nlm.nih.gov/36506547), licensed under a CC-BY license. Not internally tested by R&D Systems.
Detection of p62/SQSTM1 by Western Blot
CSE induces autophagy in ASMCs. (A) Representative Western blots and image analysis of CSE-induced p62, beclin-1, and LC3A/B protein expression. GAPDH served as reference protein and p < 0.05 was considered significant. (B) Representative confocal microscopy on mitochondria-LC3 co-localization (white arrow) after CSE-stimulation (60×, green: cytochrome C, red: LC3A/B, blue: DAPI). Statistics were calculated by Mann–Whitney U-test. Image collected and cropped by CiteAb from the following open publication (https://pubmed.ncbi.nlm.nih.gov/36430467), licensed under a CC-BY license. Not internally tested by R&D Systems.Applications for p62/SQSTM1 Antibody (864807)
Application
Recommended Usage
Immunocytochemistry
8-25 µg/mL
Sample: Immersion fixed HeLa human cervical epithelial carcinoma cell line
Sample: Immersion fixed HeLa human cervical epithelial carcinoma cell line
Immunohistochemistry
5-25 µg/mL
Sample: Immersion fixed paraffin-embedded sections of human liver
Sample: Immersion fixed paraffin-embedded sections of human liver
Immunoprecipitation
1 µg/1 mg cell lysate
Sample: Cell lysate of U2OS human osteosarcoma cell line
Sample: Cell lysate of U2OS human osteosarcoma cell line
Knockout Validated
p62/SQSTM1 is specifically detected in HeLa human cervical epithelial carcinoma parental cell line and parental U2OS cell line but is not detectable in p62/SQSTM1 knockout HeLa cell line and knockout U2OS cell line.
Simple Western
20 µg/mL
Sample: RAW 264.7 mouse monocyte/macrophage cell line treated with LPS
Sample: RAW 264.7 mouse monocyte/macrophage cell line treated with LPS
Western Blot
2 µg/mL
Sample: HeLa human cervical epithelial carcinoma cell line, RAW 264.7 mouse monocyte/macrophage cell line, and C6 rat glioma cell line untreated or treated with LPS
Sample: HeLa human cervical epithelial carcinoma cell line, RAW 264.7 mouse monocyte/macrophage cell line, and C6 rat glioma cell line untreated or treated with LPS
Reviewed Applications
Read 2 reviews rated 5 using MAB8028 in the following applications:
Formulation, Preparation, and Storage
Purification
Protein A or G purified from hybridoma culture supernatant
Reconstitution
Sterile PBS to a final concentration of 0.5 mg/mL. For liquid material, refer to CoA for concentration.
Loading...
Formulation
Lyophilized from a 0.2 μm filtered solution in PBS with Trehalose. *Small pack size (SP) is supplied either lyophilized or as a 0.2 µm filtered solution in PBS.
Shipping
Lyophilized product is shipped at ambient temperature. Liquid small pack size (-SP) is shipped with polar packs. Upon receipt, store immediately at the temperature recommended below.
Stability & Storage
Use a manual defrost freezer and avoid repeated freeze-thaw cycles.
- 12 months from date of receipt, -20 to -70 °C as supplied.
- 1 month, 2 to 8 °C under sterile conditions after reconstitution.
- 6 months, -20 to -70 °C under sterile conditions after reconstitution.
Calculators
Background: p62/SQSTM1
Long Name
Sequestosome 1
Alternate Names
A170, EBIAP, ORCA, OSIL, PDB3, Sequestosome 1, SQSTM1, ZIP3
Gene Symbol
SQSTM1
UniProt
Additional p62/SQSTM1 Products
Product Documents for p62/SQSTM1 Antibody (864807)
Certificate of Analysis
To download a Certificate of Analysis, please enter a lot or batch number in the search box below.
Note: Certificate of Analysis not available for kit components.
Product Specific Notices for p62/SQSTM1 Antibody (864807)
For research use only
Related Research Areas
Citations for p62/SQSTM1 Antibody (864807)
 Powered by Bioz
Customer Reviews for p62/SQSTM1 Antibody (864807) (2)
5 out of 5
2 Customer Ratings
Have you used p62/SQSTM1 Antibody (864807)?
Submit a review and receive an Amazon gift card!
$25/€18/£15/$25CAN/¥2500 Yen for a review with an image
$10/€7/£6/$10CAN/¥1110 Yen for a review without an image
Submit a review
Customer Images

Showing
1
-
2 of
2 reviews
Showing All
Filter By:
-
Application: Immunocytochemistry/ImmunofluorescenceSample Tested: HeLa cellsSpecies: HumanVerified Customer | Posted 08/15/2021

-
Application: Western BlotSample Tested: HeLa cellsSpecies: HumanVerified Customer | Posted 10/17/2018
There are no reviews that match your criteria.
Protocols
Find general support by application which include: protocols, troubleshooting, illustrated assays, videos and webinars.
- Antigen Retrieval Protocol (PIER)
- Antigen Retrieval for Frozen Sections Protocol
- Appropriate Fixation of IHC/ICC Samples
- Cellular Response to Hypoxia Protocols
- Chromogenic IHC Staining of Formalin-Fixed Paraffin-Embedded (FFPE) Tissue Protocol
- Chromogenic Immunohistochemistry Staining of Frozen Tissue
- ClariTSA™ Fluorophore Kits
- Detection & Visualization of Antibody Binding
- Fluorescent IHC Staining of Frozen Tissue Protocol
- Graphic Protocol for Heat-induced Epitope Retrieval
- Graphic Protocol for the Preparation and Fluorescent IHC Staining of Frozen Tissue Sections
- Graphic Protocol for the Preparation and Fluorescent IHC Staining of Paraffin-embedded Tissue Sections
- Graphic Protocol for the Preparation of Gelatin-coated Slides for Histological Tissue Sections
- ICC Cell Smear Protocol for Suspension Cells
- ICC Immunocytochemistry Protocol Videos
- ICC for Adherent Cells
- IHC Sample Preparation (Frozen sections vs Paraffin)
- Immunocytochemistry (ICC) Protocol
- Immunocytochemistry Troubleshooting
- Immunofluorescence of Organoids Embedded in Cultrex Basement Membrane Extract
- Immunofluorescent IHC Staining of Formalin-Fixed Paraffin-Embedded (FFPE) Tissue Protocol
- Immunohistochemistry (IHC) and Immunocytochemistry (ICC) Protocols
- Immunohistochemistry Frozen Troubleshooting
- Immunohistochemistry Paraffin Troubleshooting
- Immunoprecipitation Protocol
- Preparing Samples for IHC/ICC Experiments
- Preventing Non-Specific Staining (Non-Specific Binding)
- Primary Antibody Selection & Optimization
- Protocol for Heat-Induced Epitope Retrieval (HIER)
- Protocol for Making a 4% Formaldehyde Solution in PBS
- Protocol for VisUCyte™ HRP Polymer Detection Reagent
- Protocol for the Fluorescent ICC Staining of Cell Smears - Graphic
- Protocol for the Fluorescent ICC Staining of Cultured Cells on Coverslips - Graphic
- Protocol for the Preparation & Fixation of Cells on Coverslips
- Protocol for the Preparation and Chromogenic IHC Staining of Frozen Tissue Sections
- Protocol for the Preparation and Chromogenic IHC Staining of Frozen Tissue Sections - Graphic
- Protocol for the Preparation and Chromogenic IHC Staining of Paraffin-embedded Tissue Sections
- Protocol for the Preparation and Chromogenic IHC Staining of Paraffin-embedded Tissue Sections - Graphic
- Protocol for the Preparation and Fluorescent ICC Staining of Cells on Coverslips
- Protocol for the Preparation and Fluorescent ICC Staining of Non-adherent Cells
- Protocol for the Preparation and Fluorescent ICC Staining of Stem Cells on Coverslips
- Protocol for the Preparation and Fluorescent IHC Staining of Frozen Tissue Sections
- Protocol for the Preparation and Fluorescent IHC Staining of Paraffin-embedded Tissue Sections
- Protocol for the Preparation of Gelatin-coated Slides for Histological Tissue Sections
- Protocol for the Preparation of a Cell Smear for Non-adherent Cell ICC - Graphic
- R&D Systems Quality Control Western Blot Protocol
- TUNEL and Active Caspase-3 Detection by IHC/ICC Protocol
- The Importance of IHC/ICC Controls
- Troubleshooting Guide: Immunohistochemistry
- Troubleshooting Guide: Western Blot Figures
- Western Blot Conditions
- Western Blot Protocol
- Western Blot Protocol for Cell Lysates
- Western Blot Troubleshooting
- Western Blot Troubleshooting Guide
- View all Protocols, Troubleshooting, Illustrated assays and Webinars
Loading...