Human B7 homolog 1 (B7-H1), also called programmed cell death 1 ligand 1 (PDCD1L1) and programmed death ligand 1 (PDL1), is a member of the growing B7 family of immune proteins that provide signals for both stimulating and inhibiting T cell activation. Other family members include B7-1, B7-2, B7-H2, PDL2 and B7-H3. B7 proteins are members of the immunoglobulin (Ig) superfamily, their extracellular domains contain 2 Ig-like domains and all members have short cytoplasmic domains. Among the family members, they share about 20-25% amino acid identity. Human and mouse B7-H1 share approximately 70% amino acid sequence identity. B7-H1 has been identified as one of two ligands for programmed death-1 (PD-1), a member of the CD28 family of immunoreceptors. The B7-H1 gene encodes a 290 amino acid (aa) type I membrane precursor protein with a putative 18 aa signal peptide, a 221 aa extracellular domain, a 21 aa transmembrane region, and a 31 aa cytoplasmic domain. Human B7-H1 is constitutively expressed in several organs such as heart, skeletal muscle, placenta and lung, and in lower amounts in thymus, spleen, kidney and liver. B7-H1 expression is upregulated in a small fraction of activated T and B cells and a much larger fraction of activated monocytes. B7-H1 expression is also induced in dendritic cells and keratinocytes after IFN-gamma stimulation. Interaction of B7-H1 with PD-1 results in inhibition of TCR-mediated proliferation and cytokine production. The B7-H1:PD-1 pathway is involved in the negative regulation of some immune responses and may play an important role in the regulation of peripheral tolerance.

Key Product Details
Validated by
Species Reactivity
Validated:
Cited:
Applications
Validated:
Cited:
Label
Antibody Source
Product Specifications
Immunogen
Phe19-Thr239
Accession # Q9NZQ7
Specificity
Clonality
Host
Isotype
Scientific Data Images for Human PD-L1/B7-H1 Antibody
Detection of Human PD-L1/B7-H1 by Western Blot.
Western blot shows lysates of human placenta tissue. PVDF membrane was probed with 2 µg/mL of Goat Anti-Human PD-L1/B7-H1 Antigen Affinity-purified Polyclonal Antibody (Catalog # AF156) followed by HRP-conjugated Anti-Goat IgG Secondary Antibody (Catalog # HAF017). A specific band was detected for PD-L1/B7-H1 at approximately 50-55 kDa (as indicated). This experiment was conducted under reducing conditions and using Immunoblot Buffer Group 1.
PD-L1/B7-H1 in Human Colon and Colon Cancer Tissue.
PD-L1/B7-H1 was detected in immersion fixed paraffin-embedded sections of normal human colon (left panel) and human colon cancer tissue (right panel) using Goat Anti-Human PD-L1/B7-H1 Antigen Affinity-purified Polyclonal Antibody (Catalog # AF156) at 5 µg/mL overnight at 4 °C. Tissue was stained using the Anti-Goat HRP-DAB Cell & Tissue Staining Kit (brown; Catalog # CTS008) and counterstained with hematoxylin (blue). Specific staining was localized to cell membranes and cytoplasm. View our protocol for Chromogenic IHC Staining of Paraffin-embedded Tissue Sections.
Human PD-L1/B7-H1 ELISA Standard Curve.
Recombinant Human PD-L1/B7-H1 protein was serially diluted 2-fold and captured by Mouse Anti-Human PD-L1/B7-H1 Monoclonal Antibody (Catalog # MAB1561R) coated on a Clear Polystyrene Microplate (Catalog # DY990). Goat Anti-Human PD-L1/B7-H1 Antigen Affinity-purified Polyclonal Antibody (Catalog # AF156) was biotinylated and incubated with the protein captured on the plate. Detection of the standard curve was achieved by incubating Streptavidin-HRP (Catalog # DY998) followed by Substrate Solution (Catalog # DY999) and stopping the enzymatic reaction with Stop Solution (Catalog # DY994).
Detection of Human PD-L1/B7-H1 by Simple WesternTM.
Simple Western lane view shows lysates of HDLM-2 human Hodgkin's lymphoma cell line, loaded at 0.2 mg/mL. A specific band was detected for PD-L1/B7-H1 at approximately 72 kDa (as indicated) using 50 µg/mL of Goat Anti-Human PD-L1/B7-H1 Antigen Affinity-purified Polyclonal Antibody (Catalog # AF156) followed by 1:50 dilution of HRP-conjugated Anti-Goat IgG Secondary Antibody (Catalog # HAF109). This experiment was conducted under reducing conditions and using the 12-230 kDa separation system.
Detection of Chinese hamster PD-L1 by Western Blot
In vitro and ex vivo inhibition of PD-1/PD-L1 interaction.a PD-1/PD-L1 homogenous time-resolved fluorescence (HTRF) assay. b PD-L1/PD-L1 HTRF dimerization assay. c PD-1/PD-L1 NFAT reporter bioassay. d CMV recall assay: IFN gamma production measured by ELISA following stimulation of PBMCs with CMV antigens. Source data are provided as a Source data file. Image collected and cropped by CiteAb from the following publication (https://pubmed.ncbi.nlm.nih.gov/33619272), licensed under a CC-BY license. Not internally tested by R&D Systems.
Detection of Chinese hamster PD-L1 by Western Blot
Effect of compound A on ex vivo HBV-specific immune responses.a PBMCs stimulated with compound A for 1 h, followed by flow cytometric measurement of cell surface PD-L1 percentage. b PBMCs cultured in triplicate wells with HBV peptides for 10 days and T cell proliferation (thymidine incorporation) and IFN gamma secretion (ELISA) measured in the presence of compounds and antibodies. c PBMCs stimulated with compounds or antibodies overnight followed by IFN gamma producing cells measured by Fluorospot. d PBMCs collected from HBV vaccinated individuals (n = 3) on day 7 post booster vaccination were incubated with either rHBsAg alone (1 µg/ml) or rHBsAg plus compound A at 0.5 µM concentration for 5 days. Cells were then collected and stained for HBsAg-specific B cells or plasmablasts (PBs), using Atto488-labeled rHBsAg by flow cytometry. The error bars represent the standard error of mean of three individuals. statistical significance (*p ≤ 0.05, **p ≤ 0.01, ***p ≤ 0.001) was determined by unpaired two-tailed Student’s t test. Source data are provided as a Source data file. Image collected and cropped by CiteAb from the following publication (https://pubmed.ncbi.nlm.nih.gov/33619272), licensed under a CC-BY license. Not internally tested by R&D Systems.
Detection of Human PD-L1 by ELISA
Modulation of soluble co-signaling molecules in kidney-transplanted patients over time.The levels of the soluble co-signaling molecules CD30, CD40, CD137, CD40L, PD-1 and PD-L1 were assayed by ELISA in serum samples of healthy controls (n = 25) and kidney-transplanted patients (n = 59) obtained at different times: just before transplantation, and 15 days, 3 months and 1 year after transplantation. Data are shown as box-plots, in which the horizontal line within each box represents the median, the bottom and top of each box represent the 25th and 75th percentiles, the bars represent the 10th and 90th percentiles and circles indicate outliers. Unpaired and paired Wilcoxon tests were used to compare distributions between independent and dependent groups, respectively. * indicates statistically significant differences between healthy controls and kidney-transplanted patient samples, and † indicates statistically significant differences between patients samples obtained at different pre- and post-transplantation times. Image collected and cropped by CiteAb from the following publication (https://pubmed.ncbi.nlm.nih.gov/25478957), licensed under a CC-BY license. Not internally tested by R&D Systems.
Detection of Chinese hamster PD-L1 by Western Blot
Mechanism of action of compound A.a PD-L1 aAPC/CHO-K1 cells were treated with 0–500 nM compound A or compound B. PD-L1 protein visualized by native gel electrophoresis. b Native gel electrophoresis of PD-L1 protein following pre- and post-lysate treatment with compound A. c PD-L1 aAPC/CHO-K1 cell line was treated with compound A, alpha PD-1/ alpha PD-L1 antibodies, or no treatment followed by cell surface PD-L1 detected by flow cytometry. Values inside histogram represent GeoMean fluorescence intensity. d CHO-K1 cells transfected with cMyc-PD-L1 and labeled with anti-cMyc Alexa Fluor 488-conjugated antibody followed by incubation with compound A. The confocal fluorescence microscopy detects PD-L1-cMyc (green) and nucleus (blue). Images are representative of three experiments and a minimum of 50 cells observed in each experiment. e Whole-cell extracts of CHO-K1 cells co-transfected with cMyc-PD-L1 and Flag-PD-L1 were incubated with media + 0.5% DMSO, inactive (cmpd B) or active (cmpd A) compound, and subjected to immunoprecipitation (IP) with anti-cMyc magnetic beads and immunoblot with anti-Flag antibody. Blots are representative of three experiments. f PD-L1 aAPC/CHO-K1 cell line treated with compound A to allow for loss of cell surface PD-L1, followed by daily media washes. Black line represents diminishing concentration of compound A as measured by LC-MS. Red line represents reconstitution of cell surface PD-L1 as measured by flow cytometry of ≥10,000 cells per time point. g Compound A wash off and PD-L1 cell surface reconstitution in the presence of transcriptional inhibitor (actinomycin D) and protein transport inhibitor (golgi plug). Inactive compound B (gray line) referenced as negative control. Source data are provided as a Source data file. Image collected and cropped by CiteAb from the following publication (https://pubmed.ncbi.nlm.nih.gov/33619272), licensed under a CC-BY license. Not internally tested by R&D Systems.
Detection of PD-L1/B7-H1 by Western Blot
Chemotherapeutic drugs DOX and PTX increase WT1 levels in CAFs and enhance their ability to inhibit T cell proliferation. A Schematic overview of drug treatment, co-culture of CAFs and PBMCs followed by T cell proliferation assay. B Protein expression of WT1 and p53 in CAFs following DOX and PTX treatment was determined by Western blotting. GAPDH was used as a loading control. C Protein levels of STAT1, STAT3, PD-L1 levels. IDO release from DOX and PTX treated CAFs was determined by ELISA. D DOX treated CAFs were co-cultured with PBMCs and CFSE-labelled CD4+ and CD8+ T cell proliferation was determined by flow cytometry (E) PTX treated CAFs were co-cultured with PBMCs and CFSE-labelled CD4+ and CD8.+ T cell proliferation was determined by flow cytometry. Representative experiment is shown of n = 3 biological replicates. Data are mean ± SEM; * P < 0.05, ** P < 0.01, *** P < 0.001, and **** P < 0.0001 Image collected and cropped by CiteAb from the following open publication (https://pubmed.ncbi.nlm.nih.gov/40598415), licensed under a CC-BY license. Not internally tested by R&D Systems.
Detection of PD-L1/B7-H1 by Western Blot
Chemotherapeutic drugs DOX and PTX increase WT1 levels in CAFs and enhance their ability to inhibit T cell proliferation. A Schematic overview of drug treatment, co-culture of CAFs and PBMCs followed by T cell proliferation assay. B Protein expression of WT1 and p53 in CAFs following DOX and PTX treatment was determined by Western blotting. GAPDH was used as a loading control. C Protein levels of STAT1, STAT3, PD-L1 levels. IDO release from DOX and PTX treated CAFs was determined by ELISA. D DOX treated CAFs were co-cultured with PBMCs and CFSE-labelled CD4+ and CD8+ T cell proliferation was determined by flow cytometry (E) PTX treated CAFs were co-cultured with PBMCs and CFSE-labelled CD4+ and CD8.+ T cell proliferation was determined by flow cytometry. Representative experiment is shown of n = 3 biological replicates. Data are mean ± SEM; * P < 0.05, ** P < 0.01, *** P < 0.001, and **** P < 0.0001 Image collected and cropped by CiteAb from the following open publication (https://pubmed.ncbi.nlm.nih.gov/40598415), licensed under a CC-BY license. Not internally tested by R&D Systems.Applications for Human PD-L1/B7-H1 Antibody
ELISA
This antibody functions as an ELISA detection antibody when paired with Mouse Anti-Human PD-L1/B7-H1 Monoclonal Antibody (Catalog # MAB1561R).
This product is intended for assay development on various assay platforms requiring antibody pairs. We recommend the Human PD-L1/B7-H1 DuoSet ELISA Kit (Catalog # DY156) for convenient development of a sandwich ELISA or the Human/Cynomolgus Monkey PD-L1/B7-H1 Quantikine ELISA Kit (Catalog # DB7H10) for a complete optimized ELISA.
Immunohistochemistry
Sample: Immersion fixed paraffin-embedded sections of normal human colon and human colon cancer tissue
Simple Western
Sample: HDLM‑2 human Hodgkin's lymphoma cell line
Western Blot
Sample: Human placenta tissue
Reviewed Applications
Read 4 reviews rated 4.5 using AF156 in the following applications:
Formulation, Preparation, and Storage
Purification
Reconstitution
Reconstitute at 0.2 mg/mL in sterile PBS. For liquid material, refer to CoA for concentration.
Formulation
Shipping
Stability & Storage
- 12 months from date of receipt, -20 to -70 °C as supplied.
- 1 month, 2 to 8 °C under sterile conditions after reconstitution.
- 6 months, -20 to -70 °C under sterile conditions after reconstitution.
Calculators
Background: PD-L1/B7-H1
References
- Nishimura, H. and T. Honjo (2001) Trends in Immunology 22:265.
- Freeman, G.J. et al. (2000) J. Exp. Med. 192:1027.
- Latchman, Y. et al. (2001) Nat. Immunol. 2:261.
Long Name
Alternate Names
Entrez Gene IDs
Gene Symbol
UniProt
Additional PD-L1/B7-H1 Products
Product Documents for Human PD-L1/B7-H1 Antibody
Certificate of Analysis
To download a Certificate of Analysis, please enter a lot or batch number in the search box below.
Note: Certificate of Analysis not available for kit components.
Product Specific Notices for Human PD-L1/B7-H1 Antibody
For research use only
Citations for Human PD-L1/B7-H1 Antibody
 Powered by Bioz
Customer Reviews for Human PD-L1/B7-H1 Antibody (4)
Have you used Human PD-L1/B7-H1 Antibody?
Submit a review and receive an Amazon gift card!
$25/€18/£15/$25CAN/¥2500 Yen for a review with an image
$10/€7/£6/$10CAN/¥1110 Yen for a review without an image
Submit a review
Customer Images
-
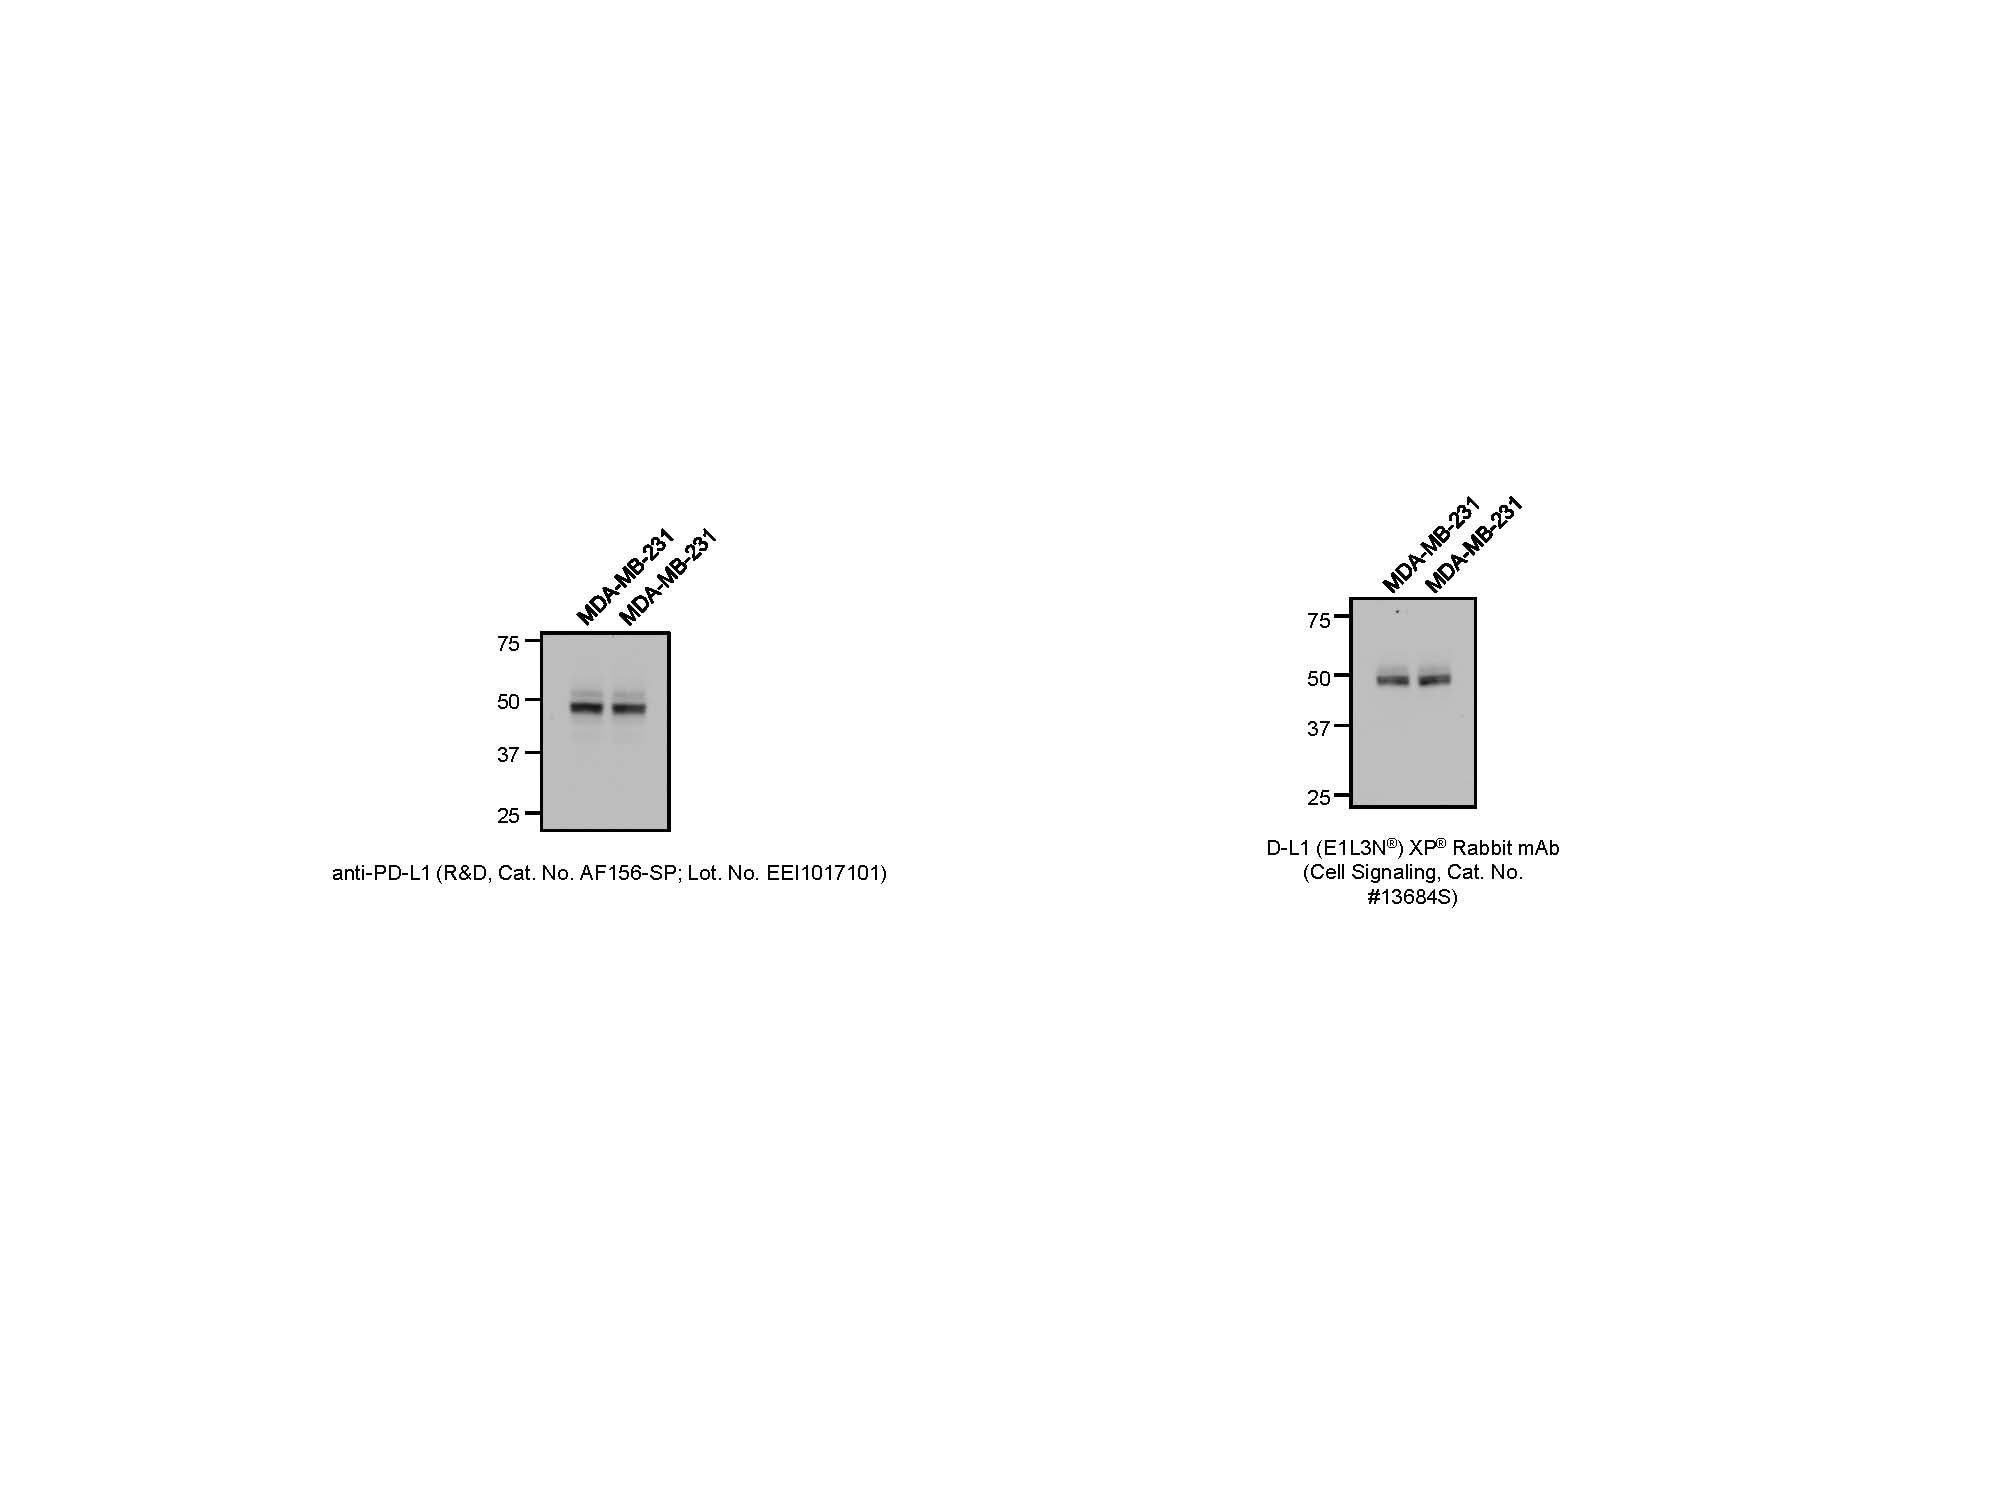
Application: Western BlotSample Tested: MDA-MB-231 human breast cancer cell lineSpecies: HumanVerified Customer | Posted 03/13/2019
-
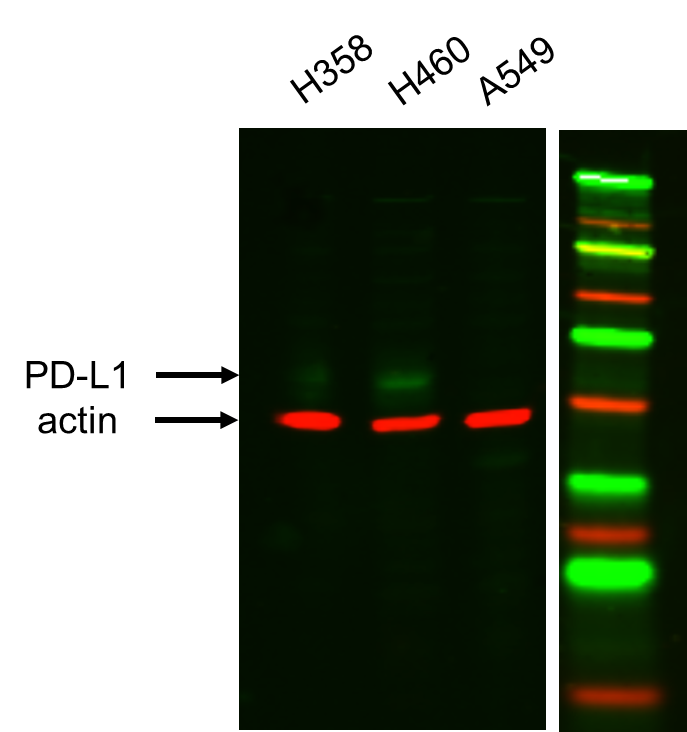
Application: Western BlotSample Tested: MDA-MB-231 human breast cancer cell line and A549 human lung carcinoma cell lineSpecies: HumanVerified Customer | Posted 10/17/2018

-
Application: Western BlotSample Tested: MDA-MB-231 human breast cancer cell lineSpecies: HumanVerified Customer | Posted 05/10/2018
-
Application: Western BlotSample Tested: A549 human lung carcinoma cell line, NCI-H460 human large cell lung carcinoma cell line and Whole cell lysate from the following human lung cancer lines: H23, H358, A549, H441.Species: HumanVerified Customer | Posted 03/23/2017
There are no reviews that match your criteria.
Protocols
Find general support by application which include: protocols, troubleshooting, illustrated assays, videos and webinars.
- Antigen Retrieval Protocol (PIER)
- Antigen Retrieval for Frozen Sections Protocol
- Appropriate Fixation of IHC/ICC Samples
- Cellular Response to Hypoxia Protocols
- Chromogenic IHC Staining of Formalin-Fixed Paraffin-Embedded (FFPE) Tissue Protocol
- Chromogenic Immunohistochemistry Staining of Frozen Tissue
- ClariTSA™ Fluorophore Kits
- Detection & Visualization of Antibody Binding
- ELISA Sample Preparation & Collection Guide
- ELISA Troubleshooting Guide
- Fluorescent IHC Staining of Frozen Tissue Protocol
- Graphic Protocol for Heat-induced Epitope Retrieval
- Graphic Protocol for the Preparation and Fluorescent IHC Staining of Frozen Tissue Sections
- Graphic Protocol for the Preparation and Fluorescent IHC Staining of Paraffin-embedded Tissue Sections
- Graphic Protocol for the Preparation of Gelatin-coated Slides for Histological Tissue Sections
- How to Run an R&D Systems DuoSet ELISA
- How to Run an R&D Systems Quantikine ELISA
- How to Run an R&D Systems Quantikine™ QuicKit™ ELISA
- IHC Sample Preparation (Frozen sections vs Paraffin)
- Immunofluorescent IHC Staining of Formalin-Fixed Paraffin-Embedded (FFPE) Tissue Protocol
- Immunohistochemistry (IHC) and Immunocytochemistry (ICC) Protocols
- Immunohistochemistry Frozen Troubleshooting
- Immunohistochemistry Paraffin Troubleshooting
- Preparing Samples for IHC/ICC Experiments
- Preventing Non-Specific Staining (Non-Specific Binding)
- Primary Antibody Selection & Optimization
- Protocol for Heat-Induced Epitope Retrieval (HIER)
- Protocol for Making a 4% Formaldehyde Solution in PBS
- Protocol for VisUCyte™ HRP Polymer Detection Reagent
- Protocol for the Preparation & Fixation of Cells on Coverslips
- Protocol for the Preparation and Chromogenic IHC Staining of Frozen Tissue Sections
- Protocol for the Preparation and Chromogenic IHC Staining of Frozen Tissue Sections - Graphic
- Protocol for the Preparation and Chromogenic IHC Staining of Paraffin-embedded Tissue Sections
- Protocol for the Preparation and Chromogenic IHC Staining of Paraffin-embedded Tissue Sections - Graphic
- Protocol for the Preparation and Fluorescent IHC Staining of Frozen Tissue Sections
- Protocol for the Preparation and Fluorescent IHC Staining of Paraffin-embedded Tissue Sections
- Protocol for the Preparation of Gelatin-coated Slides for Histological Tissue Sections
- Quantikine HS ELISA Kit Assay Principle, Alkaline Phosphatase
- Quantikine HS ELISA Kit Principle, Streptavidin-HRP Polymer
- R&D Systems Quality Control Western Blot Protocol
- Sandwich ELISA (Colorimetric) – Biotin/Streptavidin Detection Protocol
- Sandwich ELISA (Colorimetric) – Direct Detection Protocol
- TUNEL and Active Caspase-3 Detection by IHC/ICC Protocol
- The Importance of IHC/ICC Controls
- Troubleshooting Guide: ELISA
- Troubleshooting Guide: Immunohistochemistry
- Troubleshooting Guide: Western Blot Figures
- Western Blot Conditions
- Western Blot Protocol
- Western Blot Protocol for Cell Lysates
- Western Blot Troubleshooting
- Western Blot Troubleshooting Guide
- View all Protocols, Troubleshooting, Illustrated assays and Webinars