The platelet-derived growth factor (PDGF) family consists of proteins derived from four genes (PDGF-A, -B, -C, and -D) that form disulfide-linked homodimers (PDGF-AA, -BB, -CC, and -DD) and a heterodimer (PDGF-AB) (1, 2). These proteins regulate diverse cellular functions by binding to and inducing the homo- or hetero-dimerization of two receptors (PDGF R alpha and R beta ). Whereas alpha / alpha homo-dimerization is induced by PDGF-AA, -BB, -CC, and -AB, alpha / beta hetero-dimerization is induced by PDGF-AB, -BB, -CC, and -DD, and beta / beta homo-dimerization is induced only by PDGF-BB, and -DD (1 - 4). Both PDGF R alpha and R beta are members of the class III subfamily of receptor tyrosine kinases (RTK) that also includes the receptors for M-CSF, SCF and Flt3-ligand. All class III RTKs are characterized by the presence of five immunoglobulin-like domains in their extracellular region and a split kinase domain in their intracellular region. Ligand-induced receptor dimerization results in autophosphorylation in trans resulting in the activation of several intracellular signaling pathways that can lead to cell proliferation, cell survival, cytoskeletal rearrangement, and cell migration. Many cell types, including fibroblasts and smooth muscle cells, express both the alpha and beta receptors. Others have only the alpha receptors (oligodendrocyte progenitor cells, mesothelial cells, liver sinusoidal endothelial cells, astrocytes, platelets and megakaryocytes) or only the beta receptors (myoblasts, capillary endothelial cells, pericytes, T cells, myeloid hematopoietic cells and macrophages). A soluble PDGF R alpha has been detected in normal human plasma and serum as well as in the conditioned medium of the human osteosarcoma cell line MG-63 (5). Both the recombinant mouse and human soluble PDGF R alpha bind PDGF with high affinity and are potent PDGF antagonists.
Mouse PDGF R beta Antibody
R&D Systems | Catalog # AF1042

Key Product Details
Validated by
Knockout/Knockdown
Species Reactivity
Validated:
Mouse
Cited:
Human, Mouse, Rat, Primate - Macaca mulatta (Rhesus Macaque), Transgenic Mouse
Applications
Validated:
Immunohistochemistry, Western Blot, Dual RNAscope ISH-IHC Compatible
Cited:
Immunohistochemistry, Immunohistochemistry-Paraffin, Immunohistochemistry-Frozen, Western Blot, Neutralization, Flow Cytometry, Immunocytochemistry, Confocal Imaging, IHC-F
Label
Unconjugated
Antibody Source
Polyclonal Goat IgG
Loading...
Product Specifications
Immunogen
Mouse myeloma cell line NS0-derived recombinant mouse PDGF R beta
Leu32-Lys530
Accession # P05622
Leu32-Lys530
Accession # P05622
Specificity
Detects mouse PDGF R beta in direct ELISAs and Western blots. In direct ELISAs, this antibody shows approximately 35% cross-reactivity with recombinant human PDGF R beta.
Clonality
Polyclonal
Host
Goat
Isotype
IgG
Scientific Data Images for Mouse PDGF R beta Antibody
Detection of Rat and Mouse PDGF R beta by Western Blot.
Western blot shows lysates of rat spinal cord tissue, rat brain tissue, and mouse brain tissue. PVDF membrane was probed with 0.25 µg/mL of Goat Anti-Mouse PDGF R beta Antigen Affinity-purified Polyclonal Antibody (Catalog # AF1042) followed by HRP-conjugated Anti-Goat IgG Secondary Antibody (Catalog # HAF019). A specific band was detected for PDGF R beta at approximately 190 kDa (as indicated). This experiment was conducted under reducing conditions and using Immunoblot Buffer Group 1.
PDGF R beta in Mouse Embryonic Spinal Cord.
PDGF R beta was detected in immersion fixed frozen sections of mouse embryo spinal cord using 5 µg/mL Goat Anti-Mouse PDGF R beta Antigen Affinity-purified Polyclonal Antibody (Catalog # AF1042) overnight at 4 °C. Tissue was stained with the Anti-Goat HRP-DAB Cell & Tissue Staining Kit (brown; Catalog # CTS008) and counterstained with hematoxylin (blue). View our protocol for Chromogenic IHC Staining of Frozen Tissue Sections.
Detection of Mouse PDGF R beta by Immunohistochemistry
Expression of sFlt1 in pericytes at the angiogenic front. a Maximum intensity projections of confocal images from P6 retinas of the Hey1-GFP transgenic reporter mouse model stained for GFP (green), PDGFR beta + (white) and IB4 (red). Images of the first row show enrichment of Hey1-GFP+, PDGFR beta + perivascular cells in the angiogenic front in comparison to mural cells covering the remodeling central plexus around veins (middle row) and arteries (bottom row). Note strong expression of Hey1-GFP reporter in arterial ECs (bottom row). Scale bar, 50 µm. b, Quantitation of Pdgfrb expression by qPCR in P6 PDGFR beta + retinal pericytes sorted based on GFP expression in comparison to whole-retina single-cell suspension (input). Note significant enrichment of Pdgfrb in both (GFP+ and GFP−) pericyte fractions and higher expression in the Hey1-GFP+ subset. Error bars, s.e.m. p-values, Kruskal–Wallis and Dunn’s multiple comparison test. NS, not statistically significant. c Quantitation of sFlt1 expression by qPCR in sorted P6 retinal pericytes in comparison to whole-retina single-cell suspension (input). Note significant enrichment of sFlt1 expression in Hey1-GFP+ pericytes in comparison to input and GFP- pericytes. Error bars, s.e.m. p-values, one-way ANOVA and Tukey’s multiple comparison test. NS, not statistically significant Image collected and cropped by CiteAb from the following publication (https://pubmed.ncbi.nlm.nih.gov/29146905), licensed under a CC-BY license. Not internally tested by R&D Systems.
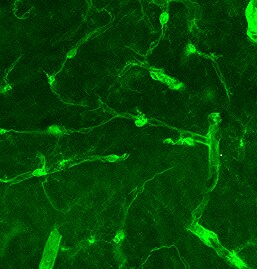
Detection of Mouse PDGF R beta by Immunocytochemistry/Immunofluorescence
VCAM1 is involved in the regulation of proliferation and morphological changes in oligodendrocytes.(a) Tissue lysates from 7-day-old NG2-Cre-driven VCAM1 conditional knockout (VCAM1fl/fl; Ng2-Cre) or control (Ctrl) mouse spinal cords or 11-day-old whole brains were immunoblotted with an antibody against MBP, CNPase, VCAM1 or actin. Data are representative of three experiments. (b–d) Antibodies against Ki67 (green) and Olig2 (red) were used for co-staining in 2-day-old spinal cord cross sections. Data are representative. The scale bars indicate 200 μm. The number of Olig2+ cells per one square millimetre was counted. Data were evaluated using Student’s t-test (**P=0.000528; n=19 slices of two independent experiments). The percentage of Ki67+ cells among the Olig2+ cells is shown. Data were evaluated using Student’s t-test (**P=0.00807; n=6 slices of two independent experiments). (e) Antibodies against Ki67 and NG2 were used for co-staining in 2-day-old spinal cord. The percentage of Ki67+ cells among the NG2+ cells per one square millimetre is shown. Data were evaluated using Student’s t-test (*P=0.0275; n=6 slices of two independent experiments). (f–h) Knock-down efficiencies of shRNAs were confirmed by immunoblotting. Data are representative of three experiments. Oligodendrocytes were transfected with VCAM1 shRNA or control, co-cultured with neurons for 2 days, and co-stained with antibodies against NF (green) and NG2 (red). Magnified images of the dotted boxes (i, attached; ii, aligned) are shown below. Data are representative. Scale bar, 100 μm. The percentage of NG2+ cells whose process tips or cell bodies were attached to axons or aligned along axons is shown. Data were evaluated using Student’s t-test (**P=0.00109 (attached cells) or P=0.00982 (aligned cells); n=6 areas of three experiments). (i,k) Oligodendrocytes were cultured on dishes coated with or without recombinant alpha 4 beta 1 integrin in a growth medium containing PDGF and bFGF. Cells were co-stained with an
Detection of Mouse PDGF R beta by Immunohistochemistry
Vascular alterations after intraocular VEGF-A injection. a Morphology of IB4-stained P6 wild-type retinal vessels at 4 h after administration of human VEGF-A165 (0.5 µl at a concentration of 5 μg μl−1). Note blunt appearance of the vessel front after VEGF-A injection but not for vehicle (PBS) control. Scale bar, 200 µm. b Quantitation of sprouts and filopodia at the front of the P6 vessel plexus after injection of VEGF-A165 or vehicle control. Error bars, s.e.m. p-values, Student’s t-test. c PDGFR beta + (green) pericytes are unaffected by short-term VEGF-A administration, whereas VEGFR2 immunosignals (white) are increased in IB4+ (red) ECs (arrowheads). Images shown correspond to insets in a. Scale bar, 100 µm. d Quantitation of VEGFR2 immunosignals intensity in the peripheral plexus of P6 retinas after injection of VEGF-A165 or vehicle control. Error bars, s.e.m. p-values, Student’s t-test. e Confocal images showing increased Esm1 immunostaining (white) in IB4+ (red) ECs in the peripheral plexus (arrowheads) after VEGF-A injection in P6 pups. Scale bar, 200 µm. f VEGF-A165 injection-mediated increase of Esm1 immunosignals (normalized to IB4+ EC area) in the peripheral capillary plexus but not at the edge of the angiogenic front in comparison to PBS-injected controls at P6. Error bars, s.e.m. p-values, Student’s t-test. NS, not statistically significant. g Short-term VEGF-A165 administration leads to clustering of Erg1+ (green) and IB4+ (red) ECs, as indicated, in thick sprout-like structures of P6 retinas. Panels in the center and on the right (scale bar, 20 µm) show higher magnification of the insets on the left (scale bar, 100 µm). Dashed lines in panels on the right outline IB4+ vessels. h Quantitation of EC density in the leading front vessel and emerging sprouts of the P6 angiogenic front after injection of VEGF-A165 or vehicle control. Error bars, s.e.m. p-values, Student’s t-test Image collected and cropped by CiteAb from the following publication (https://pubme
Detection of PDGF R beta in Mouse Embryo Brain.
Formalin-fixed paraffin-embedded tissue sections of mouse embryo were probed for PDGFRb mRNA (ACD RNAScope Probe, catalog #411388; Fast Red chromogen, ACD catalog # 322750). Adjacent tissue section was processed for immunohistochemistry using goat anti-mouse PDGFRb polyclonal antibody (R&D Systems catalog # AF1042) at 1.7ug/mL with overnight incubation at 4 degrees Celsius followed by incubation with anti-goat IgG VisUCyte HRP Polymer Antibody (Catalog # VC004) and DAB chromogen (yellow-brown). Tissue was counterstained with hematoxylin (blue). Specific staining was localized to developing vasculature.
Detection of Mouse PDGF R beta by Western Blot
PDGF autocrine loop is critical for VEGFR-2 down-expression and anti-VEGF resistance in GBM-associated ECs. a GBM tumor-derived ECs were treated with control IgG or antibody against PDGF-AA or PDGF-BB. Cell lysates were immunoblotted. b, c GBM tumor-derived ECs were transfected with control scrambled siRNA or siRNA targeting PDGFR-alpha and PDGFR-beta. b Cell lysates were immunoblotted. c Cell proliferation was determined (n = 3, mean ± SEM). d GBM tumor-derived ECs were treated with Ki8751 and crenolanib at different doses. Cell proliferation was determined 4 days after treatment. Inhibition rates were calculated and expressed as % of control cells Image collected and cropped by CiteAb from the following open publication (https://pubmed.ncbi.nlm.nih.gov/30150753), licensed under a CC-BY license. Not internally tested by R&D Systems.
Detection of Human PDGF R beta by Western Blot
PDGF induces downregulation of VEGFR-2 expression in ECs. a, b Normal human brain microvascular ECs (#1 and #2 from adult brain and #3 from fetal brain) were treated with glioma-conditioned medium (glioma-CM). RNA was isolated and subjected to transcriptome analysis by RNA deep sequencing (RNA-seq). Left, heat map for expression of VEGF receptors. Right, fold changes of VEGFR-1, VEGFR-2, and VEGFR-3 (n = 3, mean ± SEM). b Shown are FPKM values of FSP-1 (n = 3). c Normal brain ECs were treated with glioma-CM or control normal medium. Cell lysates were immunoblotted. d Gene set analysis of upregulated pathways/genes identified by RNA-seq in glioma-CM-treated ECs. e ECs were isolated from GBM tumors or peri-tumor tissues of human patients or normal brains. Cell lysates were immunoblotted. Note: the lyates were also immunoblotted in Fig. 1c, and the same blot for GAPDH was shown. f Normal brain ECs were treated with 100 ng/ml PDGF-AA, PDGF-AB, or PDGF-BB. Cell lysates were immunoblotted Image collected and cropped by CiteAb from the following open publication (https://pubmed.ncbi.nlm.nih.gov/30150753), licensed under a CC-BY license. Not internally tested by R&D Systems.
Detection of PDGF R beta by Immunohistochemistry
Single-cell transcriptomic analysis of vessel organoids (VOrs).(A) UMAP plot showing the nine major cell types isolated from day (D) 40 VOrs. (B) Violin plots showing the expression value of the typical markers in each cluster. (C) Expression pattern of cell-type-specific markers in VOrs. Relative expression level is plotted from gray (low) to blue (high) colors. (D) Immunostaining of alpha SMA for representing the smooth muscle cells in VOrs. Scale bar, 10 μm. (E) Immunostaining of PDGFR beta for representing the pericytes in VOrs. Scale bar, 10 μm. (F) Immunostaining of microglia markers (IBA1, TREM2, TMEM119) and endothelial marker CD31 in VOrs at D40. Scale bar, 20 μm. (G) Violin plots showing the expression value of the venous marker EPHB4 and arterial marker DLL4 in endothelial cell (EC) clusters. (H) Expression pattern of arterial and venous markers in EC clusters. Relative expression level is plotted from gray to green (EPHB4) or red (DLL4) colors.Cell-type analysis for vessel organoids (VOrs) by scRNA-seq and immunostaining.(A) Correlation analysis of scRNA-seq data from two batches of VOr samples. (B) Proportions of cell types among all the cells from VOrs. (C) Heatmap showing the top five most enriched genes for each cell type. (D) Immunostaining of DLL4 for labeling the arterial endothelial cells in VOrs. Scale bar, 10 μm. (E) Immunostaining of EPHB4 for labeling the venous endothelial cells in VOrs. Scale bar, 10 μm. Image collected and cropped by CiteAb from the following open publication (https://pubmed.ncbi.nlm.nih.gov/35506651), licensed under a CC-BY license. Not internally tested by R&D Systems.
Detection of Mouse PDGF R beta by Immunohistochemistry
RFC1 protein is abundantly expressed in endothelial cells and pericytes of the retinal microvessels. A Ex-vivo labeling of 20 µm radial cryo-section from PFA fixated eyeballs of naive Swiss Albino mice with anti-RFC1 antibody (red). Abundant RFC1 immunopositivity is observed along ganglion cell layer (GCL), inner plexiform layer (IPL), outer plexiform layer (OPL) where retinal microvessels forms vascular horizontal vascular beds; as well as the retinal pigment epithelium (RPE). However, this preparation limited the observation of microvessels, hence inner BRB, as it commonly included microvessels circularly rather than longitudinally. Scale bar= 25 µm B RPE which is known to express RFC1 previously is well stained with anti-RFC1 antibody (red) as our positive control. C The microvessels constituting inner BRB form the deep vascular plexus of the retina were immunohistochemically labelled with anti-RFC1 antibody in PFA fixated whole-mount retinas. D Retinal microvessels which were obtained via retinal trypsin digestion method that allowed to get only microvessels (< 9 μm diameter) were immunofluorescently labeled with anti-RFC1 antibody (n = 6 retina; red). Nuclei were labeled with Hoechst 33258 (blue) in all the rows. E The endothelial marker CD31 (green) (n = 3). The “bump-on-a log” shaped pericyte body was positively stained with anti-RFC1 antibody, but negative for endothelial marker CD31. Hence, RFC1 staining was specific. F–H RFC1 (red) also colocalized with accepted pericyte markers NG2, CD13, PDGFR-beta (green) shown respectively (n = 3/marker). Nuclei were labeled with Hoechst 33258 (blue). Scale bars =10 μm Image collected and cropped by CiteAb from the following open publication (https://pubmed.ncbi.nlm.nih.gov/37328777), licensed under a CC-BY license. Not internally tested by R&D Systems.
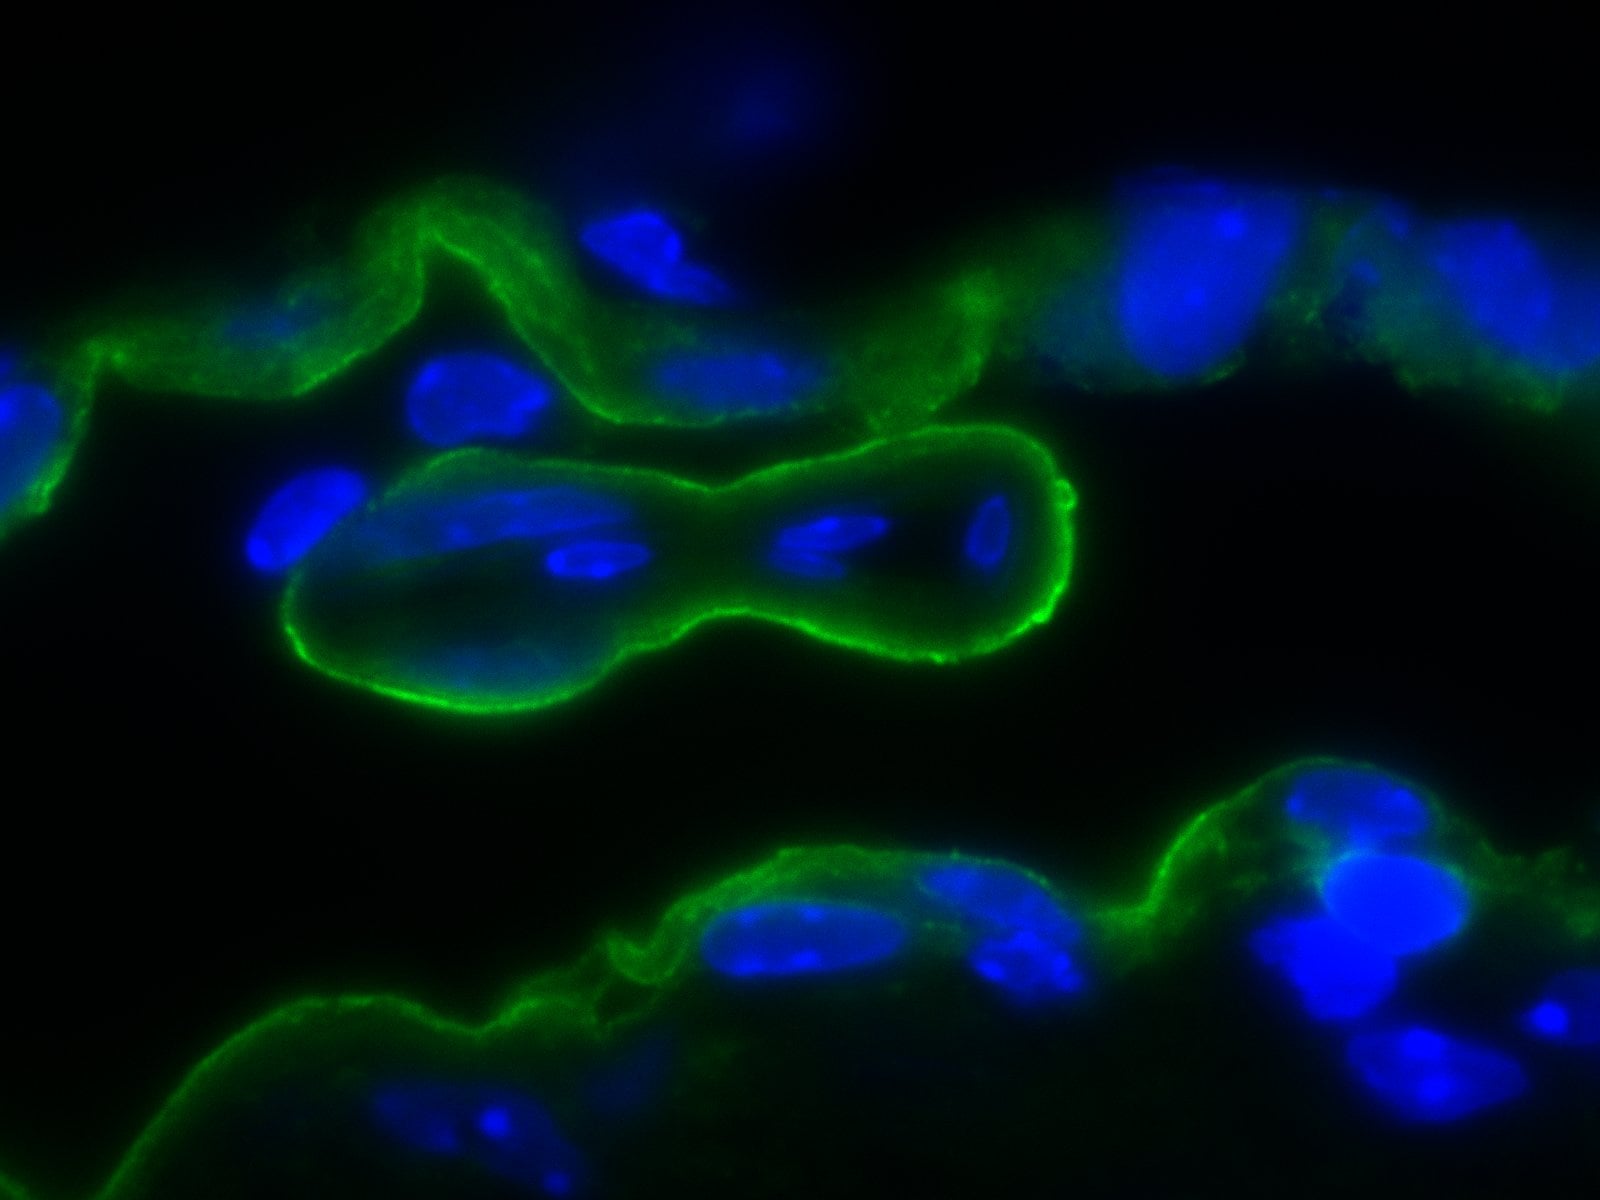
Detection of PDGF R beta by Immunohistochemistry
IL‐3 is specifically expressed in astrocytes at 14 dpi. (A) Immunofluorescent staining of CD31 (green), IL‐3 (red), and nuclei (blue) in sagittal sections at 14 dpi. (B) Immunofluorescent staining of PDGFR beta (green), IL‐3 (red), and nuclei (blue) in sagittal sections at 14 dpi. (C) Immunofluorescent staining of CD68 (green), IL‐3 (red), and nuclei (blue) in sagittal sections at 14 dpi. (D) Immunofluorescent staining of NG2 (green), IL‐3 (red), and nuclei (blue) in sagittal sections at 14 dpi. (E) Immunofluorescent staining of GFAP (green), IL‐3 (red), and nuclei (blue) in sagittal sections at 14 dpi. The region of interest (ROI) represents the boxed region on the left. Asterisks indicate the injured core. Scale bars: 200 μm (left panel) and 20 μm (right panel). n = 3 animals per group. (F) Quantification of the proportion of IL‐3+CD31+ cells in CD31+ cells, IL‐3+PDGFR beta + cells in PDGFR beta + cells, IL‐3+CD68+ cells in CD68+ cells, IL‐3+NG2+ cells in NG2+ cells, or IL‐3+GFAP+ cells in GFAP+ cells at 14 dpi. ND, no determined, **p < 0.01; ****p < 0.001 by one‐way ANOVA followed by Tukey's post hoc test. Image collected and cropped by CiteAb from the following open publication (https://pubmed.ncbi.nlm.nih.gov/39697159), licensed under a CC-BY license. Not internally tested by R&D Systems.Applications for Mouse PDGF R beta Antibody
Application
Recommended Usage
Dual RNAscope ISH-IHC Compatible
5-15 µg/mL
Sample: Immersion fixed paraffin-embedded sections of mouse embryo brain
Sample: Immersion fixed paraffin-embedded sections of mouse embryo brain
Immunohistochemistry
5-15 µg/mL
Sample: Immersion fixed frozen sections of mouse embryo spinal cord
Sample: Immersion fixed frozen sections of mouse embryo spinal cord
Western Blot
0.25 µg/mL
Sample: Rat spinal cord tissue, rat brain tissue, and mouse brain tissue
Sample: Rat spinal cord tissue, rat brain tissue, and mouse brain tissue
Reviewed Applications
Read 4 reviews rated 4.3 using AF1042 in the following applications:
Formulation, Preparation, and Storage
Purification
Antigen Affinity-purified
Reconstitution
Reconstitute at 0.2 mg/mL in sterile PBS. For liquid material, refer to CoA for concentration.
Loading...
Formulation
Lyophilized from a 0.2 μm filtered solution in PBS with Trehalose. See Certificate of Analysis for details.
*Small pack size (-SP) is supplied either lyophilized or as a 0.2 µm filtered solution in PBS.
*Small pack size (-SP) is supplied either lyophilized or as a 0.2 µm filtered solution in PBS.
Shipping
Lyophilized product is shipped at ambient temperature. Liquid small pack size (-SP) is shipped with polar packs. Upon receipt, store immediately at the temperature recommended below.
Stability & Storage
Use a manual defrost freezer and avoid repeated freeze-thaw cycles.
- 12 months from date of receipt, -20 to -70 °C as supplied.
- 1 month, 2 to 8 °C under sterile conditions after reconstitution.
- 6 months, -20 to -70 °C under sterile conditions after reconstitution.
Calculators
Background: PDGF R beta
References
- Betshotz, C. et al. (2001) BioEssays 23:494.
- Ostman, A. and A.H. Heldin (2001) Advances in Cancer Research 80:1.
- Gilbertson, D. et al. (2001) J. Biol. Chem. 276:27406.
- LaRochells, W.J. et al. (2001) Nature Cell Biol. 3:517.
- Tiesman, J. and C.E. Hart (1993) J. Biol. Chem. 5:9621.
Long Name
Platelet-derived Growth Factor Receptor beta
Alternate Names
CD140b, PDGFRB
Gene Symbol
PDGFRB
UniProt
Additional PDGF R beta Products
Product Documents for Mouse PDGF R beta Antibody
Certificate of Analysis
To download a Certificate of Analysis, please enter a lot or batch number in the search box below.
Note: Certificate of Analysis not available for kit components.
Product Specific Notices for Mouse PDGF R beta Antibody
For research use only
Related Research Areas
Citations for Mouse PDGF R beta Antibody
 Powered by Bioz
Customer Reviews for Mouse PDGF R beta Antibody (4)
4.3 out of 5
4 Customer Ratings
Have you used Mouse PDGF R beta Antibody?
Submit a review and receive an Amazon gift card!
$25/€18/£15/$25CAN/¥2500 Yen for a review with an image
$10/€7/£6/$10CAN/¥1110 Yen for a review without an image
Submit a review
Customer Images
Showing
1
-
4 of
4 reviews
Showing All
Filter By:
-
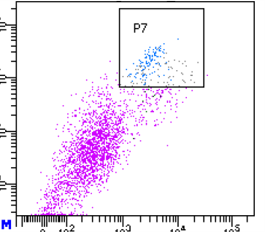
Application: Flow CytometrySample Tested: Mouse ear fibroblastSpecies: MouseVerified Customer | Posted 09/18/2022Works good

-
Application: Immunocytochemistry/ImmunofluorescenceSample Tested: Adult brain and Adult brain (hippocampus)Species: MouseVerified Customer | Posted 10/13/2020
-
Application: Immunocytochemistry/ImmunofluorescenceSample Tested: Brain tissueSpecies: MouseVerified Customer | Posted 11/02/2016
-
Application: ImmunohistochemistrySample Tested: Brain tissueSpecies: RatVerified Customer | Posted 12/16/2015Optimisation protocols of Microwave and Pressure Cooker antigen retrievals at pH6 and pH9. Concentrations 1:100, 1:200 and 1:400. In FFPE rat brain tissue. Primary antibody incubation 1 hr.
There are no reviews that match your criteria.
Protocols
Find general support by application which include: protocols, troubleshooting, illustrated assays, videos and webinars.
- Antigen Retrieval Protocol (PIER)
- Antigen Retrieval for Frozen Sections Protocol
- Appropriate Fixation of IHC/ICC Samples
- Cellular Response to Hypoxia Protocols
- Chromogenic IHC Staining of Formalin-Fixed Paraffin-Embedded (FFPE) Tissue Protocol
- Chromogenic Immunohistochemistry Staining of Frozen Tissue
- ClariTSA™ Fluorophore Kits
- Detection & Visualization of Antibody Binding
- Fluorescent IHC Staining of Frozen Tissue Protocol
- Graphic Protocol for Heat-induced Epitope Retrieval
- Graphic Protocol for the Preparation and Fluorescent IHC Staining of Frozen Tissue Sections
- Graphic Protocol for the Preparation and Fluorescent IHC Staining of Paraffin-embedded Tissue Sections
- Graphic Protocol for the Preparation of Gelatin-coated Slides for Histological Tissue Sections
- IHC Sample Preparation (Frozen sections vs Paraffin)
- ISH-IHC Protocol for Chromogenic Detection on Formalin Fixed Paraffin Embedded (FFPE) Tissue
- Immunofluorescent IHC Staining of Formalin-Fixed Paraffin-Embedded (FFPE) Tissue Protocol
- Immunohistochemistry (IHC) and Immunocytochemistry (ICC) Protocols
- Immunohistochemistry Frozen Troubleshooting
- Immunohistochemistry Paraffin Troubleshooting
- Preparing Samples for IHC/ICC Experiments
- Preventing Non-Specific Staining (Non-Specific Binding)
- Primary Antibody Selection & Optimization
- Protocol for Heat-Induced Epitope Retrieval (HIER)
- Protocol for Making a 4% Formaldehyde Solution in PBS
- Protocol for VisUCyte™ HRP Polymer Detection Reagent
- Protocol for the Preparation & Fixation of Cells on Coverslips
- Protocol for the Preparation and Chromogenic IHC Staining of Frozen Tissue Sections
- Protocol for the Preparation and Chromogenic IHC Staining of Frozen Tissue Sections - Graphic
- Protocol for the Preparation and Chromogenic IHC Staining of Paraffin-embedded Tissue Sections
- Protocol for the Preparation and Chromogenic IHC Staining of Paraffin-embedded Tissue Sections - Graphic
- Protocol for the Preparation and Fluorescent IHC Staining of Frozen Tissue Sections
- Protocol for the Preparation and Fluorescent IHC Staining of Paraffin-embedded Tissue Sections
- Protocol for the Preparation of Gelatin-coated Slides for Histological Tissue Sections
- R&D Systems Quality Control Western Blot Protocol
- TUNEL and Active Caspase-3 Detection by IHC/ICC Protocol
- The Importance of IHC/ICC Controls
- Troubleshooting Guide: Immunohistochemistry
- Troubleshooting Guide: Western Blot Figures
- Western Blot Conditions
- Western Blot Protocol
- Western Blot Protocol for Cell Lysates
- Western Blot Troubleshooting
- Western Blot Troubleshooting Guide
- View all Protocols, Troubleshooting, Illustrated assays and Webinars


