
Key Product Details
Species Reactivity
Validated:
Human, Mouse, Rat
Cited:
Human, Mouse, Rat, Canine, Primate - Macaca fascicularis (Crab-eating Monkey or Cynomolgus Macaque), Rabbit, Transgenic Mouse, Xenograft
Applications
Validated:
Immunohistochemistry, Western Blot, Immunocytochemistry, Simple Western
Cited:
Immunohistochemistry, Immunohistochemistry-Paraffin, Immunohistochemistry-Frozen, Western Blot, Flow Cytometry, Immunocytochemistry, Bioassay
Label
Unconjugated
Antibody Source
Polyclonal Goat IgG
Loading...
Product Specifications
Immunogen
E. coli-derived recombinant human SOX1
Asn242-Gly379 (Leu276Ile)
Accession # NP_005977
Asn242-Gly379 (Leu276Ile)
Accession # NP_005977
Specificity
Detects human SOX1 in direct ELISAs and Western blots.
Clonality
Polyclonal
Host
Goat
Isotype
IgG
Scientific Data Images for SOX1 Antibody
Detection of Human SOX1 by Western Blot.
Western blot shows lysates of undifferentiated iBJ6 human iPS cells and iBJ6 human iPS cells differentiated into neuroprogenitor cells. PVDF membrane was probed with 1 µg/mL of Goat Anti-Human/Mouse/Rat SOX1 Antigen Affinity-purified Polyclonal Antibody (Catalog # AF3369) followed by HRP-conjugated Anti-Goat IgG Secondary Antibody (HAF017). A specific band was detected for SOX1 at approximately 39 kDa (as indicated). This experiment was conducted under reducing conditions and using Immunoblot Buffer Group 1.
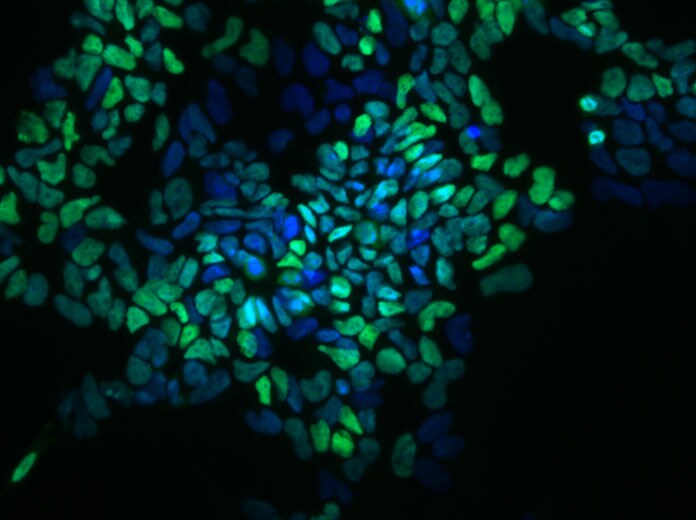
SOX1 in ectoderm differentuiated BG01V Human Embryonic Stem Cells.
SOX1 was detected in immersion fixed BG01V human embryonic stem cells differentiated into neural progenitor cells using Goat Anti-Human/Mouse/Rat SOX1 Antigen Affinity-purified Polyclonal Antibody (Catalog # AF3369) at 10 µg/mL for 3 hours at room temperature. Cells were stained using the NorthernLights™ 557-conjugated Anti-Goat IgG Secondary Antibody (red; NL001) and counterstained with DAPI (blue). Nestin was also detected using Mouse Anti-Mouse/Rat Nestin Monoclonal Antibody (MAB2736) and stained using the NorthernLights™ 493-conjugated Anti-Mouse IgG Secondary Antibody (green; Catalog # NL009). Specific staining of SOX1 was localized to nuclei. View our protocol for Fluorescent ICC Staining of Stem Cells on Coverslips.
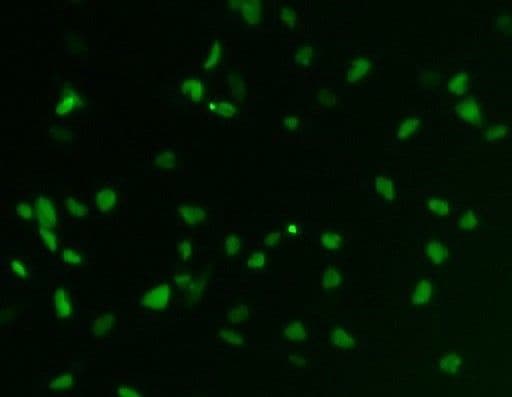
SOX1 in differentiated NTera‑2 Human Cell Line.
SOX1 was detected in immersion fixed NTera-2 human testicular embryonic carcinoma cell line differentiated with retinoic acid using Goat Anti-Human/Mouse/Rat SOX1 Antigen Affinity-purified Polyclonal Antibody (Catalog # AF3369) at 10 µg/mL for 3 hours at room temperature. Cells were stained using the NorthernLights™ 493-conjugated Anti-Goat IgG Secondary Antibody (green, upper panel; NL003) and counterstained with DAPI (blue, lower panel). View our protocol for Fluorescent ICC Staining of Cells on Coverslips.
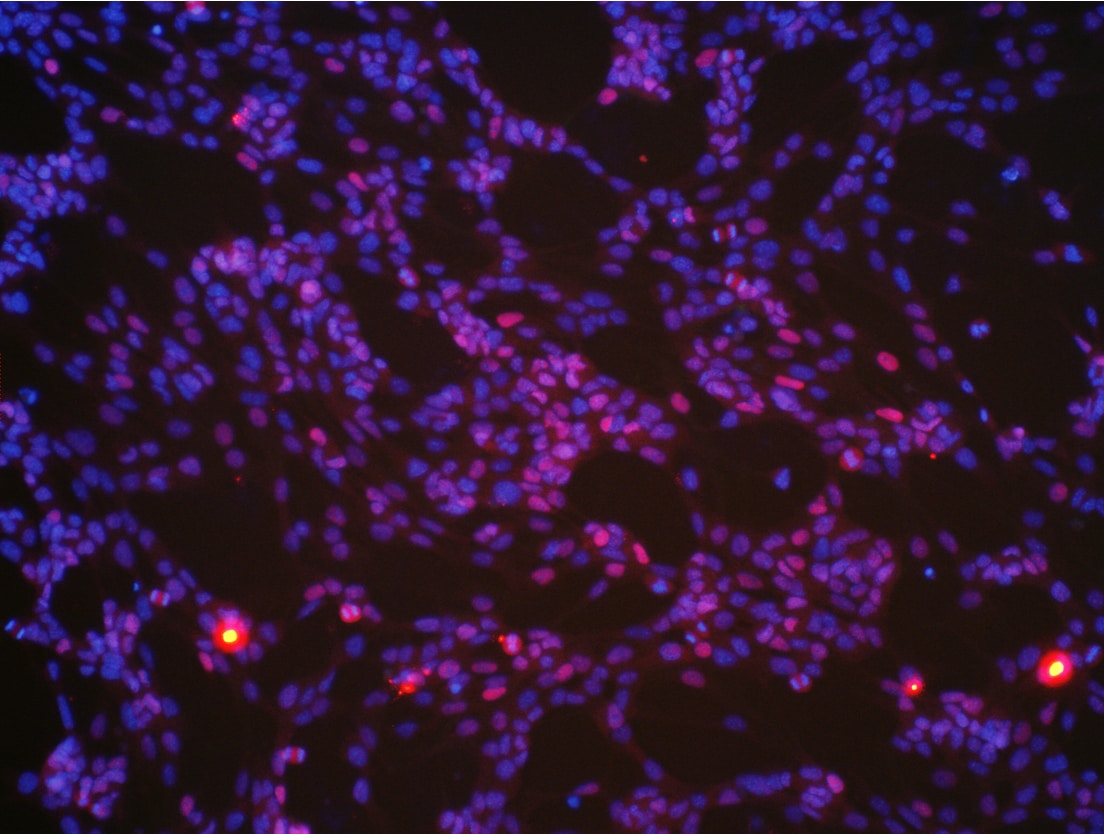
SOX1 in Rat Cortical Stem Cells.
SOX1 was detected in immersion fixed rat cortical stem cells (NSC001) using Goat Anti-Human/Mouse/Rat SOX1 Antigen Affinity-purified Polyclonal Antibody (Catalog # AF3369) at 10 µg/mL for 3 hours at room temperature. Cells were stained using the NorthernLights™ 557-conjugated Anti-Goat IgG Secondary Antibody (red, upper panel; NL001) and counterstained with DAPI (blue, lower panel). Specific staining was localized to nuclei. View our protocol for Fluorescent ICC Staining of Cells on Coverslips.
SOX1 in Mouse Cortical Stem Cells.
SOX1 was detected in immersion fixed mouse cortical stem cells (Catalog # NSC002) using Goat Anti-Human/Mouse/Rat SOX1 Antigen Affinity-purified Polyclonal Antibody (Catalog # AF3369) at 10 µg/mL for 3 hours at room temperature. Cells were stained using the NorthernLights™ 557-conjugated Anti-Goat IgG Secondary Antibody (red, upper panel; NL001) and counterstained with DAPI (blue, lower panel). Specific staining was localized to nuclei. View our protocol for Fluorescent ICC Staining of Cells on Coverslips..")
SOX1 in Human Brain (Cortex).
SOX1 was detected in immersion fixed paraffin-embedded sections of human brain (cortex) using Goat Anti-Human/Mouse/Rat SOX1 Antigen Affinity-purified Polyclonal Antibody (Catalog # AF3369) at 3 µg/mL for 1 hour at room temperature followed by incubation with the Anti-Mouse IgG VisUCyte™ HRP Polymer Antibody (VC001). Before incubation with the primary antibody, tissue was subjected to heat-induced epitope retrieval using Antigen Retrieval Reagent-Basic (CTS013). Tissue was stained using DAB (brown) and counterstained with hematoxylin (blue). Specific staining was localized to nuclei in neuron. Staining was performed using our protocol for IHC Staining with VisUCyte HRP Polymer Detection Reagents.
Detection of Human SOX1 by Simple WesternTM.
Simple Western lane view shows lysates of undifferentiated iBJ6 human iPS cells and iBJ6 human iPS cells differentiated into neuroprogenitor cells, loaded at 0.2 mg/mL. A specific band was detected for SOX1 at approximately 50 kDa (as indicated) using 10 µg/mL of Goat Anti-Human/Mouse/Rat SOX1 Antigen Affinity-purified Polyclonal Antibody (Catalog # AF3369) followed by 1:50 dilution of HRP-conjugated Anti-Goat IgG Secondary Antibody (HAF109). This experiment was conducted under reducing conditions and using the 12-230 kDa separation system.
Detection of Human SOX1 by Immunocytochemistry/Immunofluorescence
Characterization of NSCs and cortical neurons derived from FKRP‐ and CRISPR/Cas9 corrected‐iPSCsA, BRepresentative images of NSCs derived from FKRP‐ and corrected‐iPSC lines expressing SOX1, SOX2, and nestin.C, DQuantification of percentage of SOX1+ (C) and SOX2+ (D) cells in culture. The efficiency of neural induction is more than 99% in FKRP‐ and corrected‐iPSC (5D17, 5D23, and 3B17) lines. Data are mean ± s.d. n = 4 technical replicates.E, FFKRP‐ and corrected‐NSC lines can be further differentiated to cortical neural progenitor cells, expressing PAX6, OTX2, and vimentin.G–IQuantification of percentage of PAX6+ (G) and OTX2+ (H) cells in culture. About 91‐98% of cells derived from FKRP, 5D17, 5D23, and 3B17 NSC lines express PAX6 (G). About 93‐96% of cells derived from FKRP, 5D17, 5D23, and 3B17 NSC lines express OTX2 (H). Of the OTX2+ population, about 60‐67% cells are also Ki67+ cycling progenitors (I). Data are mean ± s.d. n = 4 technical replicates.J, KGlutamatergic projection neurons derived from FKRP and corrected (5D17, 5D23, and 3B17) progenitor cells. The vast majority of neurons contain vGlut1+ punctae in their neurites (labeled by Tuj1). Right panels are enlarged images from the insets of left panels.Data information: Scale bars, 50 μm. Image collected and cropped by CiteAb from the following publication (https://pubmed.ncbi.nlm.nih.gov/31566294), licensed under a CC-BY license. Not internally tested by R&D Systems.
Detection of Human SOX1 by Immunocytochemistry/Immunofluorescence
Expression of NSUN2 in the Human Developing Brain and NES Cells(A) DAPI-stained human embryo (6 weeks of gestation) marked for prosencephalon, mesencephalon, and rhombencephalon. Region in square is magnified in (B). Scale bar, 1 mm.(B) Prosencephalon labeled for NSUN2 and SOX1. Region in squares are magnified in (b′) and (b″). Arrows indicate NSUN2-positive cells. Scale bar, 100 μm.(C–F) Bright-field image (C) and immunofluorescence (D–F) of AF22 (upper panels) and Sai1 (lower panels) cells labeled for Nestin (D), SOX2 (E), and beta III-tubulin (F). Scale bar, 50 μm.(G and H) NES cells co-labeled for NSUN2 and Nestin (NES) (G) or SOX1 (H).(I) Differentiation protocol.(J–L) Differentiated AF22 and Sai1 cells (day 15) labeled for Nestin (NES; J), SOX2 (K), and beta III-tubulin (L). Scale bars: 50 μm.(M) Western blot for NSUN2, beta III-tubulin (TUBB3), GFAP, SOX2, and Nestin during differentiation (days). alpha -Tubulin served as loading control.Nuclei are counterstained with DAPI (A, B, D–F, J–L). Image collected and cropped by CiteAb from the following publication (https://linkinghub.elsevier.com/retrieve/pii/S2213671116302764), licensed under a CC-BY license. Not internally tested by R&D Systems.
Detection of Human SOX1 by Immunocytochemistry/Immunofluorescence
GPI anchored proteins are required for neural differentiation.(A). Representative example of images of hiPSC-derived EBs and EB-derived rosettes during neural differentiation. Neural induction and rosette formation upon neural induction was assessed in three cell lines using a serum-free EB generation method. On day 2 (left) of hiPSC-derived EBs from PIGAwt, PIGAc.1234C>T, and PIGAnull after forced aggregation (20X magnification, scale bar is 50μm). On day 4 (middle), single homogeneous hiPSC-EBs collected were pooled in a 10 cm plate (4X magnification, scale bar is 100μm). On day 11 (right), neuroepithelial cells appeared and neural tube-like rosettes formed (EB-derived rosettes) and scale bar is 50μm. (B). Neural induction rates from EB-derived rosettes. The percentage of EB derived rosettes was 88.8% ± 4.6, 75.5% ± 9.8 and 68.4% ± 6.9 for PIGAwt, PIGAc.1234C>T, and PIGAnull, respectively. PIGAwt versus PIGAc.1234C>T (p>0.05, NS) and PIGAwt versus PIGAnull (*p<0.05, one way ANOVA and Multiple comparisons). Neural induction from PIGAnull hiPSCs was less than 70%. All values were mean ±SD. (C). Representative confocal images showing expression of neuron stem cell marker SOX1 (in red) combined proliferation by EdU labeling in hNPCs derived from isolated neural rosettes. Nuclei were visualized with DAPI (blue) and scale bar 100μm. (D). Representative confocal images showing expression of neuron progenitor marker PAX6 (in red) and combined proliferation by EdU (in green) in hNPCs derived from isolated neural rosettes. Nuclei were visualized with DAPI (blue) and scale bar 200μm. hNPCs from PIGAnull cell lines showed reduced expression of SOX1 and PAX6. (E). Proliferation rate in hNPCs was assessed and plotted in all three cell lines. EdU positive cells were counted and normalized by total number of nuclei staining with DAPI (blue). Proliferation was significantly decreased in PIGAnull and PIGAc.1234C>T compared to PIGAwt. (F). Graphs depict the percentage of positive ce
Detection of SOX1 by Western Blot
Loss of DNMT3B impairs meso-endoderm lineage commitment. A Schematic representation of the two-step differentiation model from ESCs to EpiLCs first with Fgf beta & Activin A, & then to meso-endoderm (ME) progenitors with iGsk3. The time points of ’ collection are reported in the colour-code used throughout the figures (i.e., shades of grey for WT, shades of orange for 3BKO). b Hierarchical clustering of RNA-seq data from the in vitro differentiation & in vivo embryonic tissues derived from pre- & post-implantation mouse embryos35. Pearson’s correlation distance & Ward’s method employed to perform the analysis. c On the left, an RNA-seq heatmap showing the results of gene expression profiles clustering with K-means for WT & 3BKO (two independent clones) during the complete differentiation time course (ESC-EpiLC-ME). DEGs arising during the differentiation time course in any group identified by ANOVA-like test with edgeR54. Rows are genes, columns are samples & the scaled expression level (Z-score RPKM) is plotted. On the right, heatmap showing selected GO terms for enriched biological processes in each cluster. Terms related to meso-endoderm are highlighted in red. d Gene expression time-course for stage-specific pluripotency (naive, primed) & germ layers (mesoderm, endoderm, ectoderm) marker genes. Dots represent normalized RPKM values, averaged by replicates/conditions (n = 2 biological replicates per genotype or clone at each time point). Error bars represent standard errors. e, WB analysis of the de novo DNMTs (Dnmt3a1, Dnmt3a2, Dnmt3b), T (mesodermal marker) & Sox1 (neuro-ectodermal marker) expression during the differentiation time course. beta -actin serves as loading control. Representative of two independent experiments. Uncropped gels are provided in Supplementary Fig. 11. Image collected & cropped by CiteAb from the following open publication (https://pubmed.ncbi.nlm.nih.gov/36690616), licensed under a CC-BY license. Not internally tested by R&D Systems.
Detection of Human SOX1 by Immunocytochemistry/ Immunofluorescence
Characterization of NS/PCs derived from hiPSCs. b, Representative images (b) of immunocytochemical analysis of hiPSC-NS/PCs (NS/PC-A & NS/PC-B) using antibodies against SOX1, SOX2, & NESTIN. Inset: Hoechst nuclear staining of the same field. Scale bar, 50 μm. Image collected & cropped by CiteAb from the following open publication (https://pubmed.ncbi.nlm.nih.gov/37286713), licensed under a CC-BY license. Not internally tested by R&D Systems.
Detection of SOX1 by Western Blot
Loss of DNMT3B impairs meso-endoderm lineage commitment. A Schematic representation of the two-step differentiation model from ESCs to EpiLCs first with Fgf beta & Activin A, & then to meso-endoderm (ME) progenitors with iGsk3. The time points of ’ collection are reported in the colour-code used throughout the figures (i.e., shades of grey for WT, shades of orange for 3BKO). b Hierarchical clustering of RNA-seq data from the in vitro differentiation & in vivo embryonic tissues derived from pre- & post-implantation mouse embryos35. Pearson’s correlation distance & Ward’s method employed to perform the analysis. c On the left, an RNA-seq heatmap showing the results of gene expression profiles clustering with K-means for WT & 3BKO (two independent clones) during the complete differentiation time course (ESC-EpiLC-ME). DEGs arising during the differentiation time course in any group identified by ANOVA-like test with edgeR54. Rows are genes, columns are samples & the scaled expression level (Z-score RPKM) is plotted. On the right, heatmap showing selected GO terms for enriched biological processes in each cluster. Terms related to meso-endoderm are highlighted in red. d Gene expression time-course for stage-specific pluripotency (naive, primed) & germ layers (mesoderm, endoderm, ectoderm) marker genes. Dots represent normalized RPKM values, averaged by replicates/conditions (n = 2 biological replicates per genotype or clone at each time point). Error bars represent standard errors. e, WB analysis of the de novo DNMTs (Dnmt3a1, Dnmt3a2, Dnmt3b), T (mesodermal marker) & Sox1 (neuro-ectodermal marker) expression during the differentiation time course. beta -actin serves as loading control. Representative of two independent experiments. Uncropped gels are provided in Supplementary Fig. 11. Image collected & cropped by CiteAb from the following open publication (https://pubmed.ncbi.nlm.nih.gov/36690616), licensed under a CC-BY license. Not internally tested by R&D Systems.
Detection of Human SOX1 by Immunocytochemistry/ Immunofluorescence
Characterization of NS/PCs derived from hiPSCs. b, Representative images (b) of immunocytochemical analysis of hiPSC-NS/PCs (NS/PC-A & NS/PC-B) using antibodies against SOX1, SOX2, & NESTIN. Inset: Hoechst nuclear staining of the same field. Scale bar, 50 μm. Image collected & cropped by CiteAb from the following open publication (https://pubmed.ncbi.nlm.nih.gov/37286713), licensed under a CC-BY license. Not internally tested by R&D Systems.Applications for SOX1 Antibody
Application
Recommended Usage
Immunocytochemistry
5-15 µg/mL
Sample: Immersion fixed NTera-2 human testicular embryonic carcinoma cell line, mouse cortical stem cells, rat cortical stem cells, and BG01V human embryonic stem cells differentiated into neural progenitor cells
Sample: Immersion fixed NTera-2 human testicular embryonic carcinoma cell line, mouse cortical stem cells, rat cortical stem cells, and BG01V human embryonic stem cells differentiated into neural progenitor cells
Immunohistochemistry
3-15 µg/mL
Sample: Immersion fixed paraffin-embedded sections of human brain (cortex)
Sample: Immersion fixed paraffin-embedded sections of human brain (cortex)
Simple Western
10 µg/mL
Sample: iB6J human iPS cells differentiated into neuroprogenitor cells
Sample: iB6J human iPS cells differentiated into neuroprogenitor cells
Western Blot
1 µg/mL
Sample: iB6J human iPS cells differentiated into neuroprogenitor cells
Sample: iB6J human iPS cells differentiated into neuroprogenitor cells
Reviewed Applications
Read 5 reviews rated 5 using AF3369 in the following applications:
Formulation, Preparation, and Storage
Purification
Antigen Affinity-purified
Reconstitution
Reconstitute at 0.2 mg/mL in sterile PBS. For liquid material, refer to CoA for concentration.
Loading...
Formulation
Lyophilized from a 0.2 μm filtered solution in PBS with Trehalose. *Small pack size (SP) is supplied either lyophilized or as a 0.2 µm filtered solution in PBS.
Shipping
Lyophilized product is shipped at ambient temperature. Liquid small pack size (-SP) is shipped with polar packs. Upon receipt, store immediately at the temperature recommended below.
Stability & Storage
Use a manual defrost freezer and avoid repeated freeze-thaw cycles.
- 12 months from date of receipt, -20 to -70 °C as supplied.
- 1 month, 2 to 8 °C under sterile conditions after reconstitution.
- 6 months, -20 to -70 °C under sterile conditions after reconstitution.
Calculators
Background: SOX1
Long Name
SRY-related HMG-box 1
Alternate Names
SRY (sex determining region Y)-box 1, SRY-related HMG-box gene 1, transcription factor SOX-1
Gene Symbol
SOX1
UniProt
Additional SOX1 Products
Product Documents for SOX1 Antibody
Certificate of Analysis
To download a Certificate of Analysis, please enter a lot or batch number in the search box below.
Note: Certificate of Analysis not available for kit components.
Product Specific Notices for SOX1 Antibody
For research use only
Related Research Areas
Citations for SOX1 Antibody
 Powered by Bioz
Customer Reviews for SOX1 Antibody (5)
5 out of 5
5 Customer Ratings
Have you used SOX1 Antibody?
Submit a review and receive an Amazon gift card!
$25/€18/£15/$25CAN/¥2500 Yen for a review with an image
$10/€7/£6/$10CAN/¥1110 Yen for a review without an image
Submit a review
Customer Images
Showing
1
-
5 of
5 reviews
Showing All
Filter By:
-
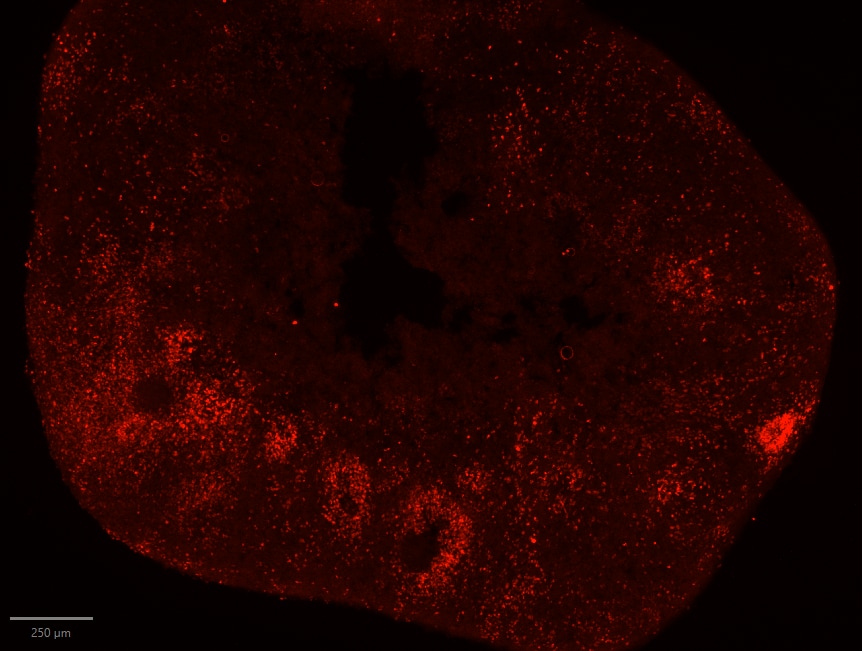
Application: Immunohistochemistry-FrozenSample Tested: striatal organoidSpecies: HumanVerified Customer | Posted 04/17/2026SOX1 staining in striatal organoid showing neural rosettesfixation: 4% PFA 4° overnight blocking + permeablization: 10% BSA + 1% TX in PBS Primary antibody: SOX1 (1:200) diluted in 4% BSA + 0.1% TX in PBS 4° overnight Secondary antibody: anti-goat 568 antibody diluted in 4% BSA + 0.1% TX RT 1h

-
Application: Immunocytochemistry/ImmunofluorescenceSample Tested: neural stem cells derived from h9Species: HumanVerified Customer | Posted 08/19/2019Neural stem cells derived from H9 cells were fixed in 4% PFA for 15 minutes. The cells were incubated in the sox1 antibody at the concentration of 5ug/ml overnight at 4 degree, the followed with secondary antibody incubation at room temperature for 1hour.
-
Application: Immunocytochemistry/ImmunofluorescenceSample Tested: hESC-derived NSCSpecies: HumanVerified Customer | Posted 03/21/2018SOX1 was detected human embryonic stem cells-derived neural stem cells using Goat Anti-Human/Mouse/Rat SOX1 Antigen Affinity-purified Polyclonal Antibody (Catalog # AF3369) at 1 µg/mL for overnight at 4°C. Cells were stained using the Donkey anti-Goat IgG (H+L) Cross-Adsorbed, Alexa Fluor® 568 and counterstained with DAPI (blue).
-
Application: Immunocytochemistry/ImmunofluorescenceSample Tested: human NSCSpecies: HumanVerified Customer | Posted 10/26/2015Specificity: Specific<br />Sensitivity: Sensitive<br />Buffer: 1% BSA + 0.3% Triton X-100 in PBS<br />Dilution: 1/100
-
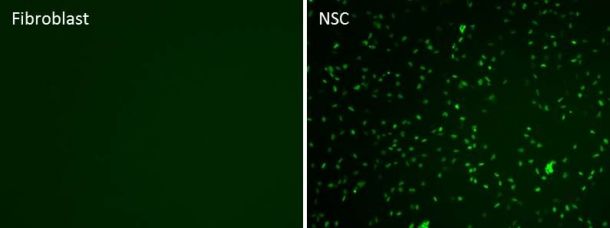
Application: Immunocytochemistry/ImmunofluorescenceSample Tested: human fibroblast and human neural stem cellsSpecies: HumanVerified Customer | Posted 10/26/2015Specificity: Specific<br />Sensitivity: Sensitive<br />Buffer: 1% BSA + 0.3% Triton X-100 in PBS<br />Dilution: 1/100
There are no reviews that match your criteria.
Protocols
Find general support by application which include: protocols, troubleshooting, illustrated assays, videos and webinars.
- Antigen Retrieval Protocol (PIER)
- Antigen Retrieval for Frozen Sections Protocol
- Appropriate Fixation of IHC/ICC Samples
- Cellular Response to Hypoxia Protocols
- Chromogenic IHC Staining of Formalin-Fixed Paraffin-Embedded (FFPE) Tissue Protocol
- Chromogenic Immunohistochemistry Staining of Frozen Tissue
- ClariTSA™ Fluorophore Kits
- Detection & Visualization of Antibody Binding
- Fluorescent IHC Staining of Frozen Tissue Protocol
- Graphic Protocol for Heat-induced Epitope Retrieval
- Graphic Protocol for the Preparation and Fluorescent IHC Staining of Frozen Tissue Sections
- Graphic Protocol for the Preparation and Fluorescent IHC Staining of Paraffin-embedded Tissue Sections
- Graphic Protocol for the Preparation of Gelatin-coated Slides for Histological Tissue Sections
- ICC Cell Smear Protocol for Suspension Cells
- ICC Immunocytochemistry Protocol Videos
- ICC for Adherent Cells
- IHC Sample Preparation (Frozen sections vs Paraffin)
- Immunocytochemistry (ICC) Protocol
- Immunocytochemistry Troubleshooting
- Immunofluorescence of Organoids Embedded in Cultrex Basement Membrane Extract
- Immunofluorescent IHC Staining of Formalin-Fixed Paraffin-Embedded (FFPE) Tissue Protocol
- Immunohistochemistry (IHC) and Immunocytochemistry (ICC) Protocols
- Immunohistochemistry Frozen Troubleshooting
- Immunohistochemistry Paraffin Troubleshooting
- Preparing Samples for IHC/ICC Experiments
- Preventing Non-Specific Staining (Non-Specific Binding)
- Primary Antibody Selection & Optimization
- Protocol for Heat-Induced Epitope Retrieval (HIER)
- Protocol for Making a 4% Formaldehyde Solution in PBS
- Protocol for VisUCyte™ HRP Polymer Detection Reagent
- Protocol for the Fluorescent ICC Staining of Cell Smears - Graphic
- Protocol for the Fluorescent ICC Staining of Cultured Cells on Coverslips - Graphic
- Protocol for the Preparation & Fixation of Cells on Coverslips
- Protocol for the Preparation and Chromogenic IHC Staining of Frozen Tissue Sections
- Protocol for the Preparation and Chromogenic IHC Staining of Frozen Tissue Sections - Graphic
- Protocol for the Preparation and Chromogenic IHC Staining of Paraffin-embedded Tissue Sections
- Protocol for the Preparation and Chromogenic IHC Staining of Paraffin-embedded Tissue Sections - Graphic
- Protocol for the Preparation and Fluorescent ICC Staining of Cells on Coverslips
- Protocol for the Preparation and Fluorescent ICC Staining of Non-adherent Cells
- Protocol for the Preparation and Fluorescent ICC Staining of Stem Cells on Coverslips
- Protocol for the Preparation and Fluorescent IHC Staining of Frozen Tissue Sections
- Protocol for the Preparation and Fluorescent IHC Staining of Paraffin-embedded Tissue Sections
- Protocol for the Preparation of Gelatin-coated Slides for Histological Tissue Sections
- Protocol for the Preparation of a Cell Smear for Non-adherent Cell ICC - Graphic
- R&D Systems Quality Control Western Blot Protocol
- TUNEL and Active Caspase-3 Detection by IHC/ICC Protocol
- The Importance of IHC/ICC Controls
- Troubleshooting Guide: Immunohistochemistry
- Troubleshooting Guide: Western Blot Figures
- Western Blot Conditions
- Western Blot Protocol
- Western Blot Protocol for Cell Lysates
- Western Blot Troubleshooting
- Western Blot Troubleshooting Guide
- View all Protocols, Troubleshooting, Illustrated assays and Webinars

