Mitochondrial brown fat uncoupling protein 1 (UCP1; also Thermogenin and UCP) is a 33 kDa member of the mitochondrial carrier family of proteins. Human and mouse UCP1 are both 307 amino acids (aa) in length and contain three solcar repetitive regions and six transmembrane segments. UCP1 is found in brown adipose tissue, where it becomes activated by fatty acids and inhibited by nucleotides. It functions as a mitochondrial transporter that creates a proton leak across the inner mitochondrial membrane, uncoupling oxidative phosphorylation from ATP synthesis. As a result, energy is dissipated in the form of heat. Human and mouse UCP1 share 79% aa sequence identity.

Key Product Details
Validated by
Biological Validation
Species Reactivity
Validated:
Human, Mouse
Cited:
Human, Mouse, Rat, Transgenic Mouse
Applications
Validated:
Western Blot, Intracellular Staining by Flow Cytometry, Immunocytochemistry, Simple Western
Cited:
Immunohistochemistry, Immunohistochemistry-Frozen, Western Blot, Flow Cytometry, Immunocytochemistry
Label
Unconjugated
Antibody Source
Monoclonal Mouse IgG2B Clone # 536435
Loading...
Product Specifications
Immunogen
E. coli-derived recombinant human UCP1
Met1-Thr307
Accession # P25874
Met1-Thr307
Accession # P25874
Specificity
Detects human and mouse UCP1 in Western blots.
Clonality
Monoclonal
Host
Mouse
Isotype
IgG2B
Scientific Data Images for UCP1 Antibody (536435)
Detection of Human UCP1 by Western Blot.
Western blot shows recombinant human UCP1, recombinant human UCP2, recombinant human UCP3, and recombinant human UCP4 (5 ng/lane). PVDF Membrane was probed with 0.5 µg/mL of Mouse Anti-Human/Mouse UCP1 Monoclonal Antibody (Catalog # MAB6158) followed by HRP-conjugated Anti-Mouse IgG Secondary Antibody (Catalog # HAF007). This experiment was conducted under reducing conditions and using Immunoblot Buffer Group 2.
Detection of Mouse UCP1 by Western Blot.
Western blot shows lysates of mouse brown adipose tissue and mouse adipose tissue. PVDF Membrane was probed with 0.5 µg/mL of Mouse Anti-Human/Mouse UCP1 Monoclonal Antibody (Catalog # MAB6158) followed by HRP-conjugated Anti-Mouse IgG Secondary Antibody (Catalog # HAF007). A specific band was detected for UCP1 at approximately 33 kDa (as indicated). This experiment was conducted under reducing conditions and using Immunoblot Buffer Group 2.
UCP1 in Human Mesenchymal Stem Cells.
UCP1 was detected in immersion fixed human mesenchymal stem cells undifferentiated (lower panel) or differentiated into adipocytes (upper panel) using Mouse Anti-Human/Mouse UCP1 Monoclonal Antibody (Catalog # MAB6158) at 10 µg/mL for 3 hours at room temperature. Cells were stained using the NorthernLights™ 557-conjugated Anti-Mouse IgG Secondary Antibody (red; Catalog # NL007) and counterstained with DAPI (blue). Specific staining was localized to cytoplasm. View our protocol for Fluorescent ICC Staining of Stem Cells on Coverslips.
Detection of UCP1 in 3T3-L1 Mouse Cell Line by Flow Cytometry.
3T3-L1 mouse embryonic fibroblast adipose-like cell line was stained with Mouse Anti-Human/Mouse UCP1 Monoclonal Antibody (Catalog # MAB6158, filled histogram) or isotype control antibody (Catalog # MAB0041, open histogram) followed by anti-Mouse IgG PE-conjugated Secondary Antibody (Catalog # F0102B). To facilitate intracellular staining, cells were fixed with Flow Cytometry Fixation Buffer (Catalog # FC004) and permeabilized with Flow Cytometry Permeabilization/Wash Buffer I (Catalog # FC005). View our protocol for Staining Intracellular Molecules.
Detection of Mouse UCP1 by Simple WesternTM.
Simple Western lane view shows lysates of mouse adipose tissue and mouse brown adipose tissue, loaded at 0.5 mg/mL. A specific band was detected for UCP1 at approximately 37 kDa (as indicated) using 2.5 µg/mL of Mouse Anti-Human/Mouse UCP1 Monoclonal Antibody (Catalog # MAB6158). This experiment was conducted under reducing conditions and using the 12-230 kDa separation system.
Detection of Mouse UCP1 by Immunohistochemistry
IRX3/Irx3 expression is induced in browning adipose tissues.(A) Relative mRNA levels of Ucp1 and Irx3 in IWAT from mice under cold stress (4 °C) for one week (n = 6) and at 25 °C (n = 8). (B–C) Relative mRNA levels of Ucp1 and Irx3 in IWAT (B) and BAT (C) from mice subjected to PBS or CL-316,243 for 10 days. For A–C, gene expression was normalized to 36b4. (D–E) Protein levels of Ucp1 and Irx3 (left) and the quantification value of Irx3 relative to Hsp90 (right) in IWAT (D) and BAT (E) in the mice subjected to PBS or CL-316,243 treatment. (F) Representative images of immunohistochemical staining in IWAT from mice subjected to PBS or CL-316,243 treatment (scale bar, 50 μm for the upper and middle panels, and 100 μm for the bottom panel). (G) PET-CT, gross image, HE staining (scale bar, 20 μm), and electron microscopy (scale bar, 5 μm) of the browning WAT from pheochromocytoma patients. (H) Representative images of immunohistochemical staining in oWAT from pheochromocytoma patients (scale bar, 100 μm for the upper panel, and 50 μm for the bottom panel). Data were presented as mean ± s.e.m. *P < 0.05, **P < 0.01, ***P < 0.001. The results are representative of at least three independent experiments. IWAT, inguinal white adipose tissue. BAT, brown adipose tissue. Image collected and cropped by CiteAb from the following publication (https://pubmed.ncbi.nlm.nih.gov/28988979), licensed under a CC-BY license. Not internally tested by R&D Systems.
Detection of Human UCP1 by Western Blot
BMP7 upregulated browning markers in both SC and DN derived differentiated adipocytes. SC and DN preadipocytes were differentiated and treated as in Figure 1. (A) Browning content as estimated by BATLAS Webtool (n = 9); (B) texture sum variance as quantified by laser-scanning cytometry (n = 5); quantification of UCP1 gene expression by (C) RNA-sequencing (n = 9) and (D) RT-qPCR normalized to GAPDH (n = 5). (E) UCP1 protein expression normalized to beta -actin (n = 5); (F) representative UCP1 immunostaining images visualized by confocal microscopy. Nucleus was stained using propidium iodide (PI), BF represents bright field image. Scale bars represent 10 μm. (G) Quantification of UCP1 immunostaining intensity assisted by laser-scanning cytometry (n = 4000 cells of 4 donors). Data expressed as mean ± SD. * p < 0.05, ** p < 0.01, *** p < 0.001. Statistics: Paired t-test (A,B,G), GLM (C), and one-way ANOVA with Tukey’s post-test (D,E). Image collected and cropped by CiteAb from the following publication (https://pubmed.ncbi.nlm.nih.gov/34832860), licensed under a CC-BY license. Not internally tested by R&D Systems.
Detection of Mouse UCP1 by Western Blot
MYPT1 is crucial for scWAT beiging in mice. b UCP1 immunoblotting of mitochondrial fraction of scWATs from AAV-injected Mypt1flox/flox mice (left). Densitometric quantification of UCP1 immunoblotting (right). n = 7 per group. Image collected & cropped by CiteAb from the following open publication (https://pubmed.ncbi.nlm.nih.gov/36175407), licensed under a CC-BY license. Not internally tested by R&D Systems.
Detection of Mouse UCP1 by Western Blot
MYPT1 is crucial for scWAT beiging in mice. gMypt1+/flox::Pdgfra-Cre mice exposed to 12 °C for 1 week (upper left). Immunoblotting of mitochondrial fraction of scWATs (lower left). Densitometric quantification of UCP1 immunoblot (right). n = 5 per group. P-JMJD1A immunoblotting of scWAT (inset). Image collected & cropped by CiteAb from the following open publication (https://pubmed.ncbi.nlm.nih.gov/36175407), licensed under a CC-BY license. Not internally tested by R&D Systems.
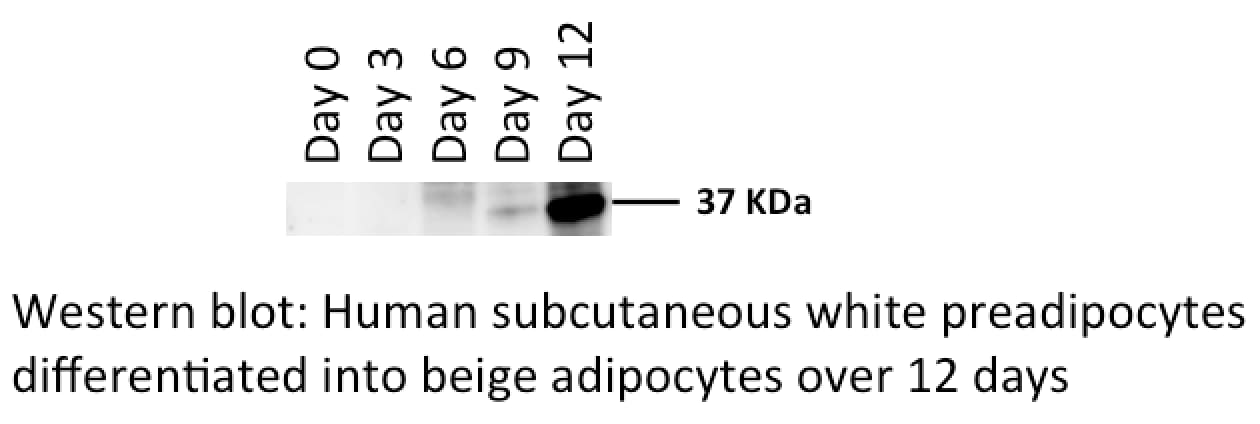
Detection of Human UCP1 by Western Blot
Expression of thermogenic markers was elevated following long-term rosiglitazone treatment and subsided upon beige (B) to white (W) transition. Human primary abdominal subcutaneous preadipocytes were differentiated to B for 14 days (B14), then either the B culture conditions were applied for an additional 14 days (B21 and B28) or were replaced by a W differentiation medium (B14W7 and B14W14). As a negative control, W adipocytes were differentiated by their specific cocktail (W14, W21, and W28). UCP1 (A) gene, (B) protein, (C) CIDEA, and (D) LEP gene expression. Gene expression was normalized to GAPDH and protein expression to beta -actin. Data are presented as mean ± SD. n = 6. * p < 0.05, ** p < 0.01. We carried out statistics using Friedman’s test with Dunn’s multiple comparison test (A) or one-way ANOVA with Tukey’s post hoc test (B–D). Image collected and cropped by CiteAb from the following open publication (https://pubmed.ncbi.nlm.nih.gov/35337160), licensed under a CC-BY license. Not internally tested by R&D Systems.
Detection of UCP1 by Western Blot
BAT converts to white-like adipose tissue of rabbits following birth. (a) Workflow for validation of BAT whitening in rabbits. (b) MRI images of rabbits iBAT and dBAT at different ages. (c) Fat fraction of rabbit iBAT and dBAT. (d) Anatomical images of rabbit dBAT and iBAT at 14 days and 4 months of age. (e) H&E staining results of rabbit iBAT and ingWAT at different ages. Scale bars, 50 µm. (f) UCP1 protein levels of rabbit iBAT and ingWAT at different ages. (g) UCP1 staining of iBAT_D14, ingWAT_D1 and ingWAT_D14 of rabbits. Scale bars, 20 µm. Data represent mean ± SEM, **P < 0.01, ***P < 0.001, ****P < 0.0001. Image collected and cropped by CiteAb from the following open publication (https://pubmed.ncbi.nlm.nih.gov/36000239), licensed under a CC-BY license. Not internally tested by R&D Systems.
Detection of UCP1 by Western Blot
BAT converts to white-like adipose tissue of rabbits following birth. (a) Workflow for validation of BAT whitening in rabbits. (b) MRI images of rabbits iBAT and dBAT at different ages. (c) Fat fraction of rabbit iBAT and dBAT. (d) Anatomical images of rabbit dBAT and iBAT at 14 days and 4 months of age. (e) H&E staining results of rabbit iBAT and ingWAT at different ages. Scale bars, 50 µm. (f) UCP1 protein levels of rabbit iBAT and ingWAT at different ages. (g) UCP1 staining of iBAT_D14, ingWAT_D1 and ingWAT_D14 of rabbits. Scale bars, 20 µm. Data represent mean ± SEM, **P < 0.01, ***P < 0.001, ****P < 0.0001. Image collected and cropped by CiteAb from the following open publication (https://pubmed.ncbi.nlm.nih.gov/36000239), licensed under a CC-BY license. Not internally tested by R&D Systems.Applications for UCP1 Antibody (536435)
Application
Recommended Usage
Immunocytochemistry
8-25 µg/mL
Sample: Immersion fixed human mesenchymal stem cells differentiated into adipocytes
Sample: Immersion fixed human mesenchymal stem cells differentiated into adipocytes
Intracellular Staining by Flow Cytometry
0.25 µg/106 cells
Sample: 3T3‑L1 mouse embryonic fibroblast adipose-like cell line fixed with Flow Cytometry Fixation Buffer (Catalog # FC004) and permeabilized with Flow Cytometry Permeabilization/Wash Buffer I (Catalog # FC005)
Sample: 3T3‑L1 mouse embryonic fibroblast adipose-like cell line fixed with Flow Cytometry Fixation Buffer (Catalog # FC004) and permeabilized with Flow Cytometry Permeabilization/Wash Buffer I (Catalog # FC005)
Simple Western
2.5 µg/mL
Sample: Mouse brown adipose tissue
Sample: Mouse brown adipose tissue
Western Blot
0.5 µg/mL
Sample: Mouse brown adipose tissue and mouse adipose tissue
Sample: Mouse brown adipose tissue and mouse adipose tissue
Reviewed Applications
Read 2 reviews rated 5 using MAB6158 in the following applications:
Flow Cytometry Panel Builder
Bio-Techne Knows Flow Cytometry
Save time and reduce costly mistakes by quickly finding compatible reagents using the Panel Builder Tool.
Advanced Features
- Spectra Viewer - Custom analysis of spectra from multiple fluorochromes
- Spillover Popups - Visualize the spectra of individual fluorochromes
- Antigen Density Selector - Match fluorochrome brightness with antigen density

Formulation, Preparation, and Storage
Purification
Protein A or G purified from hybridoma culture supernatant
Reconstitution
Reconstitute at 0.5 mg/mL in sterile PBS. For liquid material, refer to CoA for concentration.
Loading...
Formulation
Lyophilized from a 0.2 μm filtered solution in PBS with Trehalose. *Small pack size (SP) is supplied either lyophilized or as a 0.2 µm filtered solution in PBS.
Shipping
Lyophilized product is shipped at ambient temperature. Liquid small pack size (-SP) is shipped with polar packs. Upon receipt, store immediately at the temperature recommended below.
Stability & Storage
Use a manual defrost freezer and avoid repeated freeze-thaw cycles.
- 12 months from date of receipt, -20 to -70 °C as supplied.
- 1 month, 2 to 8 °C under sterile conditions after reconstitution.
- 6 months, -20 to -70 °C under sterile conditions after reconstitution.
Calculators
Background: UCP1
Long Name
Uncoupling Protein 1
Alternate Names
SLC25A7, Thermogenin
Gene Symbol
UCP1
UniProt
Additional UCP1 Products
Product Documents for UCP1 Antibody (536435)
Certificate of Analysis
To download a Certificate of Analysis, please enter a lot or batch number in the search box below.
Note: Certificate of Analysis not available for kit components.
Product Specific Notices for UCP1 Antibody (536435)
For research use only
Related Research Areas
Citations for UCP1 Antibody (536435)
 Powered by Bioz
Customer Reviews for UCP1 Antibody (536435) (2)
5 out of 5
2 Customer Ratings
Have you used UCP1 Antibody (536435)?
Submit a review and receive an Amazon gift card!
$25/€18/£15/$25CAN/¥2500 Yen for a review with an image
$10/€7/£6/$10CAN/¥1110 Yen for a review without an image
Submit a review
Customer Images
Showing
1
-
2 of
2 reviews
Showing All
Filter By:
-
Application: Western BlotSample Tested: Primary Brown Adipocytes, Primary brown adipocytes- cultured and Brown adipose tissueSpecies: MouseVerified Customer | Posted 07/12/2017Ucp1 antibody utilized for western blot and tested against Ucp1 KO brown adipose tissue. Emmett, M. J. et al. Histone deacetylase 3 prepares brown adipose tissue for acute thermogenic challenge. Nature 546, 544-548 (2017).
-
Application: Western BlotSample Tested: Brown adipose tissueSpecies: HumanVerified Customer | Posted 07/11/2017

There are no reviews that match your criteria.
Protocols
Find general support by application which include: protocols, troubleshooting, illustrated assays, videos and webinars.
- 7-Amino Actinomycin D (7-AAD) Cell Viability Flow Cytometry Protocol
- Appropriate Fixation of IHC/ICC Samples
- Cellular Response to Hypoxia Protocols
- ClariTSA™ Fluorophore Kits
- Detection & Visualization of Antibody Binding
- Extracellular Membrane Flow Cytometry Protocol
- Flow Cytometry Protocol for Cell Surface Markers
- Flow Cytometry Protocol for Staining Membrane Associated Proteins
- Flow Cytometry Staining Protocols
- Flow Cytometry Troubleshooting Guide
- ICC Cell Smear Protocol for Suspension Cells
- ICC Immunocytochemistry Protocol Videos
- ICC for Adherent Cells
- Immunocytochemistry (ICC) Protocol
- Immunocytochemistry Troubleshooting
- Immunofluorescence of Organoids Embedded in Cultrex Basement Membrane Extract
- Immunohistochemistry (IHC) and Immunocytochemistry (ICC) Protocols
- Intracellular Flow Cytometry Protocol Using Alcohol (Methanol)
- Intracellular Flow Cytometry Protocol Using Detergents
- Intracellular Nuclear Staining Flow Cytometry Protocol Using Detergents
- Intracellular Staining Flow Cytometry Protocol Using Alcohol Permeabilization
- Intracellular Staining Flow Cytometry Protocol Using Detergents to Permeabilize Cells
- Preparing Samples for IHC/ICC Experiments
- Preventing Non-Specific Staining (Non-Specific Binding)
- Primary Antibody Selection & Optimization
- Propidium Iodide Cell Viability Flow Cytometry Protocol
- Protocol for Liperfluo
- Protocol for VisUCyte™ HRP Polymer Detection Reagent
- Protocol for the Characterization of Human Th22 Cells
- Protocol for the Characterization of Human Th9 Cells
- Protocol for the Fluorescent ICC Staining of Cell Smears - Graphic
- Protocol for the Fluorescent ICC Staining of Cultured Cells on Coverslips - Graphic
- Protocol for the Preparation and Fluorescent ICC Staining of Cells on Coverslips
- Protocol for the Preparation and Fluorescent ICC Staining of Non-adherent Cells
- Protocol for the Preparation and Fluorescent ICC Staining of Stem Cells on Coverslips
- Protocol for the Preparation of a Cell Smear for Non-adherent Cell ICC - Graphic
- Protocol: Annexin V and PI Staining by Flow Cytometry
- Protocol: Annexin V and PI Staining for Apoptosis by Flow Cytometry
- R&D Systems Quality Control Western Blot Protocol
- TUNEL and Active Caspase-3 Detection by IHC/ICC Protocol
- The Importance of IHC/ICC Controls
- Troubleshooting Guide: Fluorokine Flow Cytometry Kits
- Troubleshooting Guide: Western Blot Figures
- Western Blot Conditions
- Western Blot Protocol
- Western Blot Protocol for Cell Lysates
- Western Blot Troubleshooting
- Western Blot Troubleshooting Guide
- View all Protocols, Troubleshooting, Illustrated assays and Webinars
Loading...
Associated Pathways
