Akt, also known as protein kinase B (PKB), is a central kinase in such diverse cellular processes as glucose uptake, cell cycle progression, and apoptosis. Three highly homologous members define the Akt family: Akt1 (PKB alpha ), Akt2 (PKB beta ), and Akt3 (PKB gamma ). All three Akts contain an amino-terminal pleckstrin homology domain, a central kinase domain, and a carboxyl-terminal regulatory domain.
Akt Pan Specific Antibody (281046)
R&D Systems | Catalog # MAB2055

Key Product Details
Validated by
Biological Validation
Species Reactivity
Validated:
Human, Mouse, Rat
Cited:
Human, Mouse, Rat, Transgenic Mouse
Applications
Validated:
Immunohistochemistry, Western Blot, Intracellular Staining by Flow Cytometry, Immunocytochemistry, Simple Western, CyTOF-ready
Cited:
Immunohistochemistry, Immunohistochemistry-Frozen, Western Blot, Simple Western, Bioassay, Infared Microscopy
Label
Unconjugated
Antibody Source
Monoclonal Mouse IgG2B Clone # 281046
Loading...
Product Specifications
Immunogen
E. coli-derived recombinant human Akt1
Ser2-Ala480
Accession # P31749
Ser2-Ala480
Accession # P31749
Specificity
Detects human, mouse and rat Akt in direct ELISAs and Western blots.
Clonality
Monoclonal
Host
Mouse
Isotype
IgG2B
Scientific Data Images for Akt Pan Specific Antibody (281046)
Detection of Human/Mouse Akt by Western Blot.
Western blot shows lysates of MCF-7 human breast cancer cell line, MBA-MB-123 human breast cancer cell line, and TS1 mouse helper T cell line. PVDF membrane was probed with 0.2 µg/mL Mouse Anti-Human/Mouse/Rat Akt Pan Specific Monoclonal Antibody (Catalog # MAB2055) followed by HRP-conjugated Anti-Mouse IgG Secondary Antibody (Catalog # HAF007). This experiment was conducted under reducing conditions and using Immunoblot Buffer Group 4.
Detection of Human Akt Pan Specific by Western Blot.
Western blot shows Recombinant Human Active Akt1 (Catalog # 1775-KS), recombinant human Akt2, and recombinant human Akt3 (5 ng/lane). PVDF membrane was probed with 0.2 µg/mL Mouse Anti-Human/Mouse/Rat Akt Pan Specific Monoclonal Antibody (Catalog # MAB2055) followed by HRP-conjugated Anti-Mouse IgG Secondary Antibody (Catalog # HAF007). This experiment was conducted under reducing conditions and using Immunoblot Buffer Group 4.
Akt in MDA‑MB‑231 Human Cell Line.
Akt was detected in immersion fixed MDA-MB-231 human breast cancer cell line using Mouse Anti-Human/ Mouse/Rat Akt Monoclonal Antibody (Catalog # MAB2055) at 10 µg/mL for 3 hours at room temperature. Cells were stained using the NorthernLights™ 557-conjugated Anti-Mouse IgG Secondary Antibody (yellow; Catalog # NL007) and counter-stained with DAPI (blue). View our protocol for Fluorescent ICC Staining of Cells on Coverslips. in 293T Human Cell Line.")
Akt (pan) in 293T Human Cell Line.
Akt pan specific (panels A and C) and Akt1 (E17K Mutation) (panels B and D) were detected in immersion fixed 293T human embryonic kidney cell line transfected with wild type (panels A and B) or E17K mutated (panels C and D) Akt1 using Mouse Anti-Human/Mouse/Rat Akt Pan Specific Monoclonal Antibody (Catalog # MAB2055) and Mouse Anti-Human Akt1 (E17K Mutation) Monoclonal Antibody (Catalog # MAB6815). Both antibodies were used at 10 µg/mL for 3 hours at room temperature. Cells were stained using the NorthernLights™ 557-conjugated Anti-Mouse IgG Secondary Antibody (red; Catalog # NL007) and counterstained with DAPI (blue). Specific staining was localized to plasma membranes and cytoplasm. View our protocol for Fluorescent ICC Staining of Cells on Coverslips.
Akt Pan Specific in Human Breast Cancer Tissue.
Akt was detected in immersion fixed paraffin-embedded sections of human breast cancer tissue using Mouse Anti-Human/Mouse/Rat Akt Pan Specific Monoclonal Antibody (Catalog # MAB2055) at 5 µg/mL for 1 hour at room temperature followed by incubation with the Anti-Mouse IgG VisUCyte™ HRP Polymer Antibody (VC001). Before incubation with the primary antibody, tissue was subjected to heat-induced epitope retrieval using Antigen Retrieval Reagent-Basic (CTS013). Tissue was stained using DAB (brown) and counterstained with hematoxylin (blue). Specific staining was localized to cytoplasm in epithelial cells. Staining was performed using our IHC Staining with VisUCyte HRP Polymer Detection Reagents.
Akt Pan Specific in Mouse Spleen Tissue.
Akt was detected in immersion fixed paraffin-embedded sections of mouse spleen tissue using Mouse Anti-Human/Mouse/Rat Akt Pan Specific Monoclonal Antibody (Catalog # MAB2055) at 5 µg/mL for 1 hour at room temperature followed by incubation with the Anti-Mouse IgG VisUCyte™ HRP Polymer Antibody (VC001). Before incubation with the primary antibody, tissue was subjected to heat-induced epitope retrieval using Antigen Retrieval Reagent-Basic (CTS013). Tissue was stained using DAB (brown) and counterstained with hematoxylin (blue). Specific staining was localized to cytoplasm in lymphocytes. Staining was performed using our IHC Staining with VisUCyte HRP Polymer Detection Reagents.
Detection of Akt in MCF‑7 Human Cell Line by Flow Cytometry.
MCF-7 human breast cancer cell line was stained with Mouse Anti-Human/Mouse/Rat Akt Monoclonal Antibody (Catalog # MAB2055, filled histogram) or isotype control antibody (Catalog # MAB0041, open histogram), followed by Phycoerythrin-conjugated Anti-Mouse IgG F(ab')2Secondary Antibody (Catalog # F0102B). To facilitate intracellular staining, cells were fixed with paraformaldehyde and permeabilized with saponin.
Detection of Human Akt by Simple WesternTM.
Simple Western lane view shows lysates of MCF‑7 human breast cancer cell line, loaded at 0.2 mg/mL. A specific band was detected for Akt at approximately 62 kDa (as indicated) using 2 µg/mL of Mouse Anti-Human/Mouse/Rat Akt Pan Specific Monoclonal Antibody (Catalog # MAB2055). This experiment was conducted under reducing conditions and using the 12-230 kDa separation system.
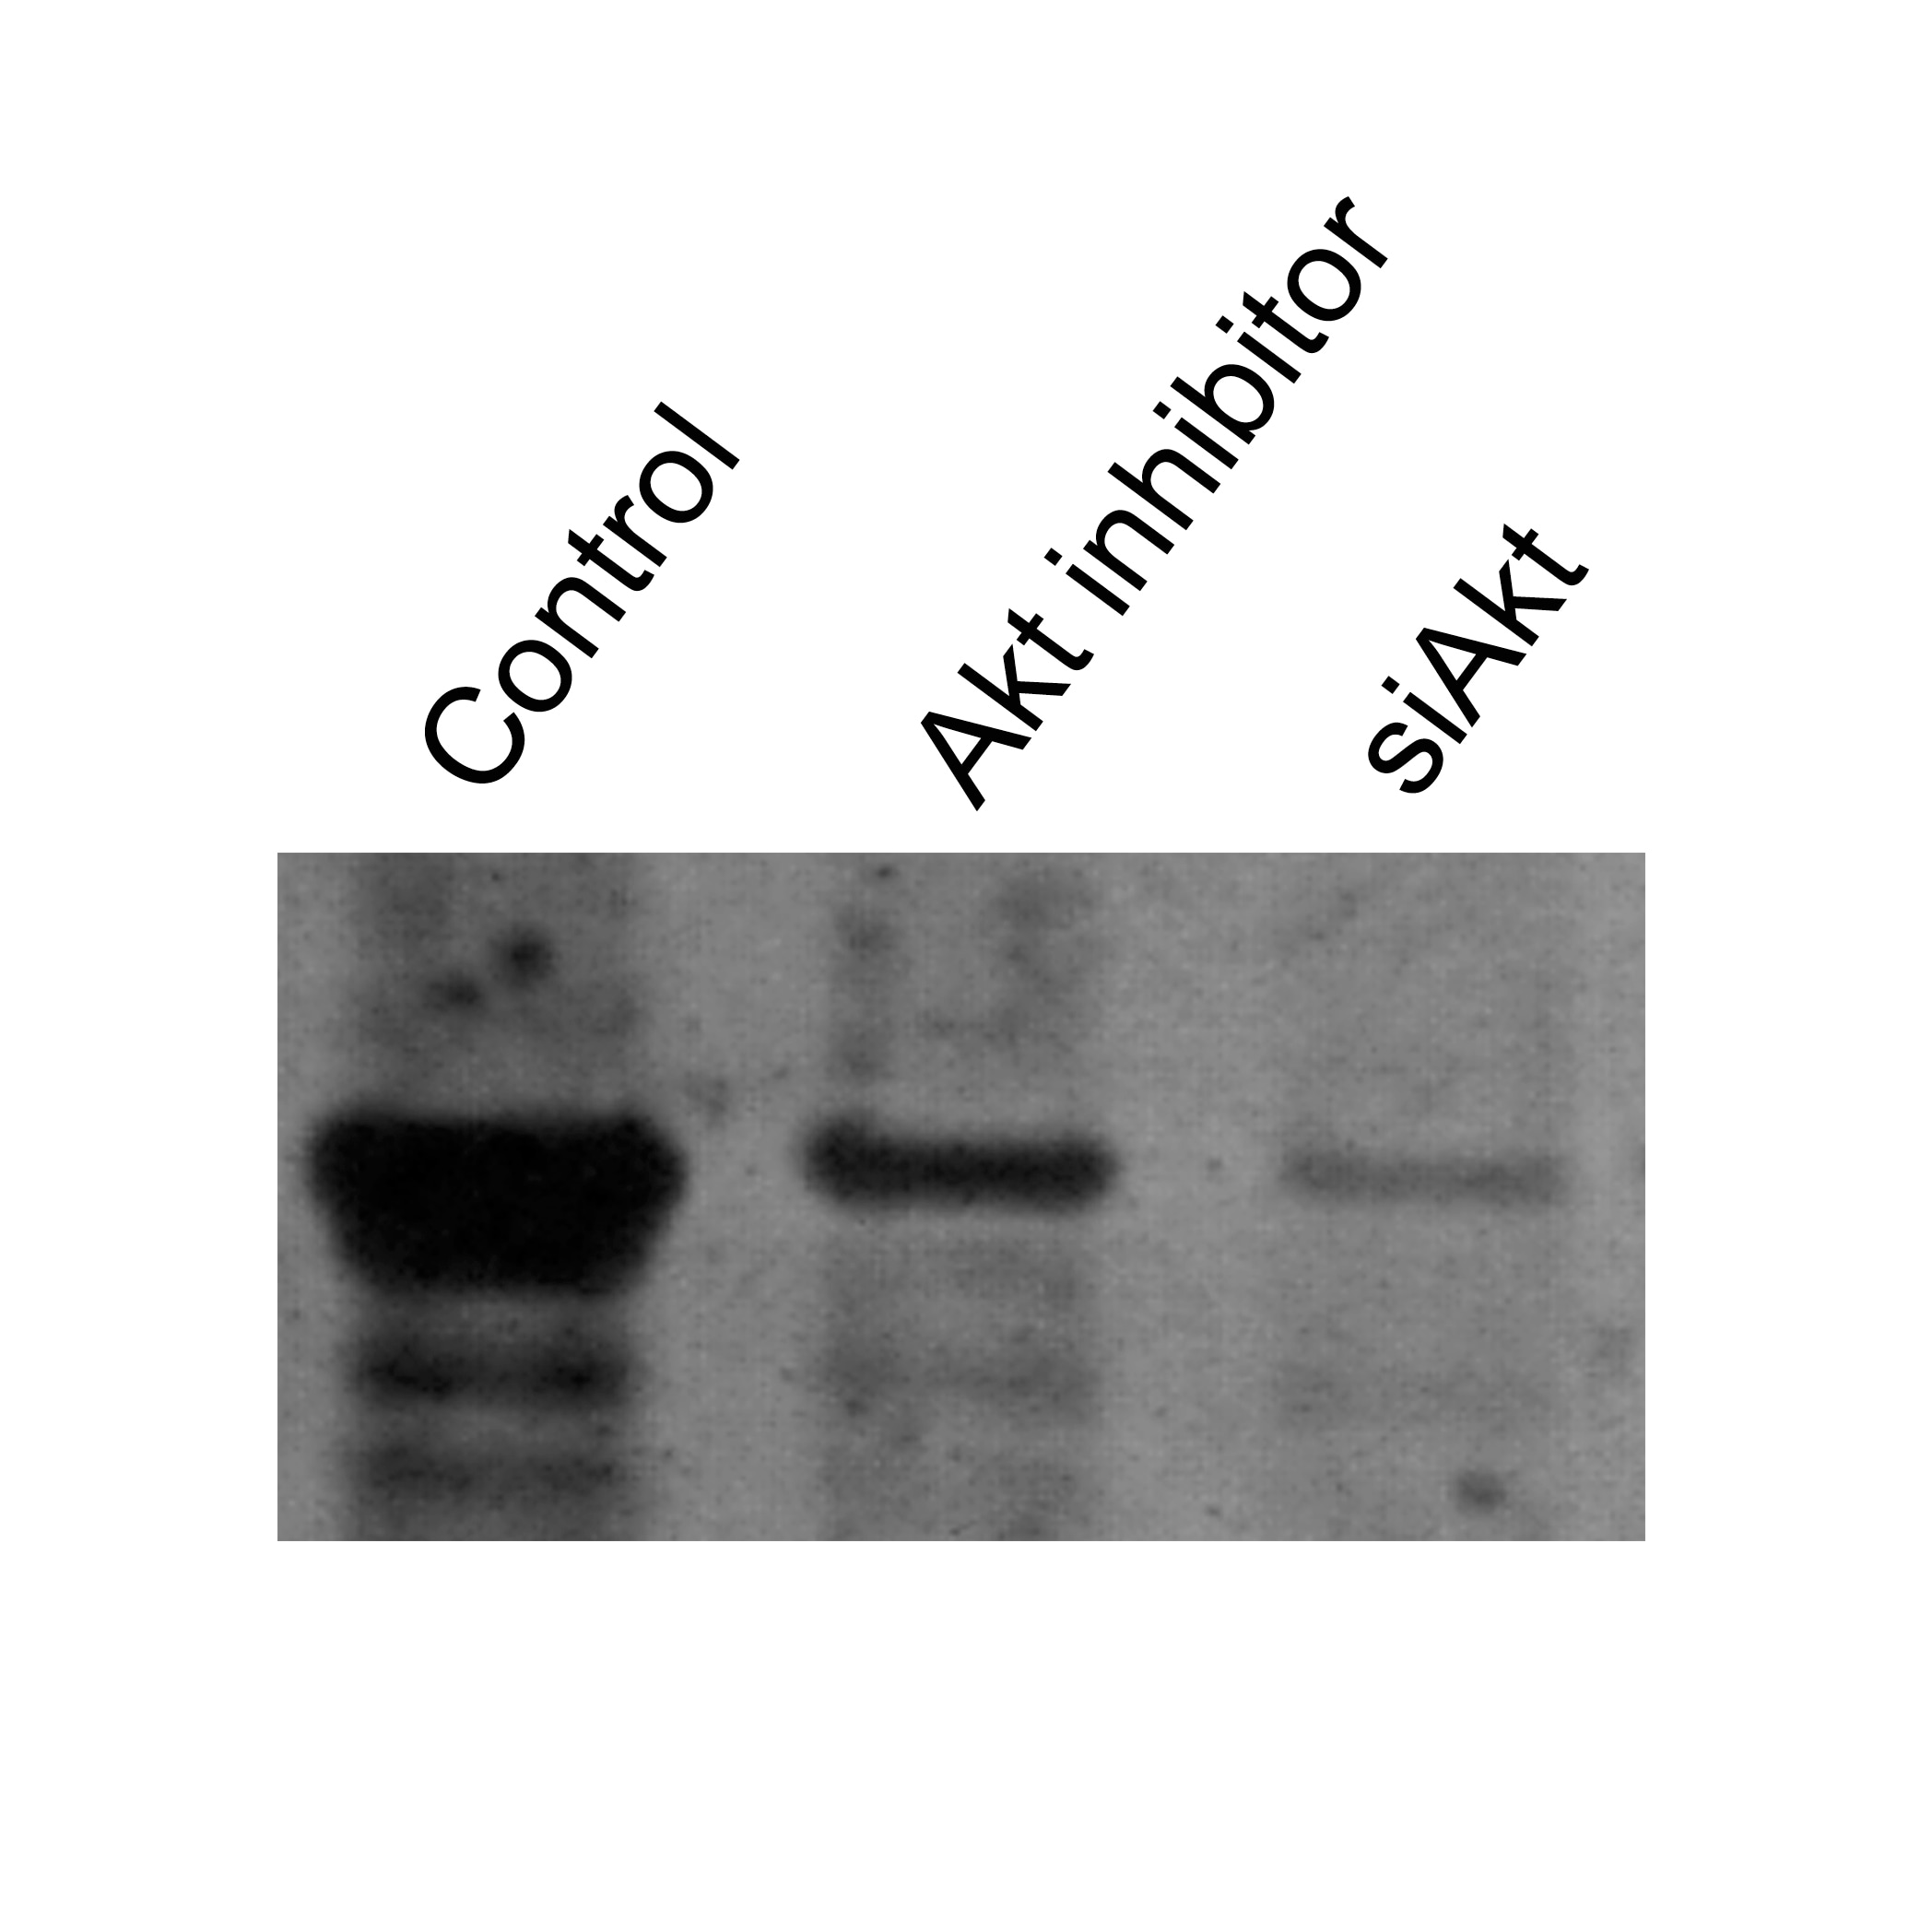
Detection of Human AKT by Western Blot
DDC up-regulates MMP-1 through ERK1/2 and Akt activation(A) Co-cultures were treated with 100 μM DDC for the indicated time. Phosphorylation of ERK1/2, p38 and Akt were determined by Western blotting analysis. The corresponding non-phosphorylated ERK1/2, p38, Akt and beta -actin were used for protein loading control. (B) Co-cultures were treated with or without 100 μM DDC for 24 h in the presence or absence of ERK1/2 inhibitor (U0126, 10 μM). MMP-1 protein levels were analysed by Western blotting. (C) Co-cultures were treated with or without 100 μM DDC for 24 h in the presence or absence of p38 inhibitor (SB203580, 10 μM). MMP-1 protein levels were analysed by Western blotting. (D) Co-cultures were treated with or without 100 μM DDC for 24 h in the presence or absence of Akt inhibitor (T3830, 50 μM). MMP-1 protein levels were analysed by Western blotting. Image collected and cropped by CiteAb from the following publication (https://pubmed.ncbi.nlm.nih.gov/23577625), licensed under a CC-BY license. Not internally tested by R&D Systems.
Detection of Human AKT by Western Blot
p38 inhibitor SB203580 improves the up-regulation of MMP-1 by DDC through stimulating ERK1/2Co-cultures were treated with or without 100 μM DDC for 1 h in the presence or absence of p38 inhibitor (SB203580, 10 μM). Phosphorylation of ERK1/2, p38 and Akt in LX-2 cells of co-cultures were determined by Western blotting analysis. Image collected and cropped by CiteAb from the following publication (https://pubmed.ncbi.nlm.nih.gov/23577625), licensed under a CC-BY license. Not internally tested by R&D Systems.
Detection of Mouse AKT by Western Blot
Activation of ErbB and WNT signaling pathways in kidneys from Cdh16Cre::Tfebfs mice.Transcriptional and biochemical analyses were performed on Cdh16Cre and Cdh16Cre::Tfebfs mice. (A,B) Tables show the relative increase of genes related to the ErbB (A) and WNT (B) pathways in the microarray analyses performed on kidneys from P0 Cdh16Cre::Tfebfs mice. Graphs show real-time PCR validations performed on kidneys from Cdh16Cre::Tfebfs mice at different stages (P0, P12, P30). Data are shown as the average (± SEM) of at least three Cdh16Cre::Tfebfs mice normalized versus wild-type mice. (C,D) Immunoblot analyses performed on (C) P30 kidney tissues and (D) primary kidney cells isolated from Cdh16Cre::Tfebfs mice to evaluate ErbB and WNT activation status. Each replicate is a distinct biological sample. ErbB signaling was assessed by looking at phosphoAKT (Ser473) to total AKT ratio, and phosphoERK1 (T202/Y204)/ERK2(T185/Y187) to total ERK ratio; WNT signaling was assessed by quantifying beta -catenin and CCND1 (Cyclin D1) protein levels. Graphs represent the densitometry quantification of Western blot bands. Values are normalized to actin when not specified and are shown as an average (± SEM) (*p<0.05, **p<0.01, ***p<0.001, two-sided, Student’s t test).DOI:https://dx.doi.org/10.7554/eLife.17047.00710.7554/eLife.17047.008Figure 3—source data 1.Complete list of 294 genes (represented by 361 probesets) significantly induced (FDR≤0.05) in the KSP_P0 microarray dataset (GSE62977).The genes are ranked by decreasing signed ratio (KSP_P0/CTL).DOI:https://dx.doi.org/10.7554/eLife.17047.00810.7554/eLife.17047.009Figure 3—source data 2.Complete list of 628 genes (represented by 729 probesets) significantly induced (FDR≤0.05) in the KSP_P14 microarray dataset (GSE63376).The genes are ranked by decreasing signed ratio (KSP_P14/CTL).DOI:https://dx.doi.org/10.7554/eLife.17047.009Complete list of 294 genes (represented by 361 probesets) significantly induced (FDR≤0.05) in the KSP_P0 microarray
Detection of Human AKT by Western Blot
Phospho-proteome profiling results of LX-2 cells co-cultured with C3A–CYP2E1 cells with or without DDC treatment and detection of the effect of DDC on intracellular kinases in LX-2 cells of co-cultures200 μg of total cell lysates from LX-2 cells co-cultured with C3A-2E1 cells with or without 100 μM DDC for 1 h were incubated with membranes of the human phospho-MAPK Array Kit according to the manufacturer's instructions. Phospho MAPK Array data were developed on X-ray films following exposure to chemiluminescent reagents. 20 μg aliquots of total cell lysates from LX-2 cells were subjected to Western blotting analysis. (A) Template showing the location of MAPK antibodies spotted onto the human phospho-MAPK Array Kit. (B) The activation status of ERK1/2 in LX-2 cells co-cultured with C3A-2E1 cells after DDC treatment. (C) The activation status of p38 in LX-2 cells co-cultured with C3A-2E1 cells after DDC treatment. (D) The activation status of Akt in LX-2 cells co-cultured with C3A-2E1 cells after DDC treatment. (E) The activation status of ERK1/2, p38 and Akt in LX-2 cells co-cultured with C3A cells after DDC treatment. Image collected and cropped by CiteAb from the following publication (https://pubmed.ncbi.nlm.nih.gov/23577625), licensed under a CC-BY license. Not internally tested by R&D Systems.
Detection of Mouse AKT by Western Blot
Biochemical analysis of ErbB signaling.Immunoblot analysis performed on P90 kidneys from Cdh16Cre::Tfebfs mice (A) and P90 Cdh16CreErt2::Tfebfs animals induced with tamoxifen at P14 (B) and at P30 (C), respectively. Each replicate is a different biological sample. ErbB was analyzed by quantifying phosphoAKT (Ser473) to total AKT, and phosphoERK1 (T202/Y204)/ERK2(T185/Y187) to total ERK; graphs are the densitometry quantifications of Western blot bands normalized to wild-type line and are shown as an average (± SEM) (*p<0.05, **p<0.01, ***p<0.001, two-sided Student’s t test).DOI:https://dx.doi.org/10.7554/eLife.17047.011 Image collected and cropped by CiteAb from the following publication (https://elifesciences.org/articles/17047), licensed under a CC-BY license. Not internally tested by R&D Systems.
Detection of Mouse AKT by Western Blot
Activation of ErbB and WNT signaling pathways in kidneys from Cdh16Cre::Tfebfs mice.Transcriptional and biochemical analyses were performed on Cdh16Cre and Cdh16Cre::Tfebfs mice. (A,B) Tables show the relative increase of genes related to the ErbB (A) and WNT (B) pathways in the microarray analyses performed on kidneys from P0 Cdh16Cre::Tfebfs mice. Graphs show real-time PCR validations performed on kidneys from Cdh16Cre::Tfebfs mice at different stages (P0, P12, P30). Data are shown as the average (± SEM) of at least three Cdh16Cre::Tfebfs mice normalized versus wild-type mice. (C,D) Immunoblot analyses performed on (C) P30 kidney tissues and (D) primary kidney cells isolated from Cdh16Cre::Tfebfs mice to evaluate ErbB and WNT activation status. Each replicate is a distinct biological sample. ErbB signaling was assessed by looking at phosphoAKT (Ser473) to total AKT ratio, and phosphoERK1 (T202/Y204)/ERK2(T185/Y187) to total ERK ratio; WNT signaling was assessed by quantifying beta -catenin and CCND1 (Cyclin D1) protein levels. Graphs represent the densitometry quantification of Western blot bands. Values are normalized to actin when not specified and are shown as an average (± SEM) (*p<0.05, **p<0.01, ***p<0.001, two-sided, Student’s t test).DOI:https://dx.doi.org/10.7554/eLife.17047.00710.7554/eLife.17047.008Figure 3—source data 1.Complete list of 294 genes (represented by 361 probesets) significantly induced (FDR≤0.05) in the KSP_P0 microarray dataset (GSE62977).The genes are ranked by decreasing signed ratio (KSP_P0/CTL).DOI:https://dx.doi.org/10.7554/eLife.17047.00810.7554/eLife.17047.009Figure 3—source data 2.Complete list of 628 genes (represented by 729 probesets) significantly induced (FDR≤0.05) in the KSP_P14 microarray dataset (GSE63376).The genes are ranked by decreasing signed ratio (KSP_P14/CTL).DOI:https://dx.doi.org/10.7554/eLife.17047.009Complete list of 294 genes (represented by 361 probesets) significantly induced (FDR≤0.05) in the KSP_P0 microarray
Detection of Human AKT by Simple Western
ACPA inhibits p-Akt, induces p-JNK and affects levels of specific metabolites in NSCLC lines.a Principal component analysis (PCA) score plot: Metabolomics profiling of control and ACPA-treated A549, H1299, H358, and H838 cells. b Changes in variable importance in projection (VIP) values for 19 metabolites in A549 cells. c, d, e Changes in VIP values for 20 metabolites in H1299, H358, and H838 cells. Significantly changed metabolites (*p < 0.05, indicated by arrows) were matched to apoptotic pathways. f, g, h, i Increase and decrease in several metabolites of ACPA-treated A549, H1299, H358, and H838 cells (*p < 0.05). j Simple Western showing total Akt, p-Akt (S473), total JNK46 and JNK54 and p-JNK46 and p-JNK54 (T183/Y185) in A549 cells at 24 hours after treatment with IC50 dose of ACPA. k Relative expression levels of Akt and p-Akt for control and ACPA-treated A549 cells after normalization by total vinculin protein. l Relative expression levels of JNK (46 and 54 kDa) and p-JNK for control and ACPA-treated A549 cells after normalization by total vinculin protein. *p < 0.05, Student’s t-test. All tests were done in quadruplicates. Image collected and cropped by CiteAb from the following publication (https://pubmed.ncbi.nlm.nih.gov/33431819), licensed under a CC-BY license. Not internally tested by R&D Systems.Applications for Akt Pan Specific Antibody (281046)
Application
Recommended Usage
CyTOF-ready
Ready to be labeled using established conjugation methods. No BSA or other carrier proteins that could interfere with conjugation.
Immunocytochemistry
8-25 µg/mL
Sample: Immersion fixed human peripheral blood mononuclear cells, MDA-MB-231 human breast cancer cell line, and 293T human embryonic kidney cell line transfected with wild type or E17K mutated Akt1
Sample: Immersion fixed human peripheral blood mononuclear cells, MDA-MB-231 human breast cancer cell line, and 293T human embryonic kidney cell line transfected with wild type or E17K mutated Akt1
Immunohistochemistry
5-25 µg/mL
Sample: 1mmersion fixed paraffin-embedded sections of human breast cancer tissue and mouse spleen tissue
Sample: 1mmersion fixed paraffin-embedded sections of human breast cancer tissue and mouse spleen tissue
Intracellular Staining by Flow Cytometry
2.5 µg/106 cells
Sample: MCF‑7 human breast cancer cell line fixed with paraformaldehyde and permeabilized with saponin
Sample: MCF‑7 human breast cancer cell line fixed with paraformaldehyde and permeabilized with saponin
Simple Western
2 µg/mL
Sample: MCF‑7 human breast cancer cell line
Sample: MCF‑7 human breast cancer cell line
Western Blot
0.2 µg/mL
Sample: MCF-7 human breast cancer cell line, MBA-MB-123 human breast cancer cell line, and TS1 mouse helper T cell line
Sample: MCF-7 human breast cancer cell line, MBA-MB-123 human breast cancer cell line, and TS1 mouse helper T cell line
Reviewed Applications
Read 3 reviews rated 4.3 using MAB2055 in the following applications:
Flow Cytometry Panel Builder
Bio-Techne Knows Flow Cytometry
Save time and reduce costly mistakes by quickly finding compatible reagents using the Panel Builder Tool.
Advanced Features
- Spectra Viewer - Custom analysis of spectra from multiple fluorochromes
- Spillover Popups - Visualize the spectra of individual fluorochromes
- Antigen Density Selector - Match fluorochrome brightness with antigen density

Formulation, Preparation, and Storage
Purification
Protein A or G purified from hybridoma culture supernatant
Reconstitution
Reconstitute at 0.5 mg/mL in sterile PBS. For liquid material, refer to CoA for concentration.
Loading...
Formulation
Lyophilized from a 0.2 μm filtered solution in PBS with Trehalose. *Small pack size (SP) is supplied either lyophilized or as a 0.2 µm filtered solution in PBS.
Shipping
Lyophilized product is shipped at ambient temperature. Liquid small pack size (-SP) is shipped with polar packs. Upon receipt, store immediately at the temperature recommended below.
Stability & Storage
Use a manual defrost freezer and avoid repeated freeze-thaw cycles.
- 12 months from date of receipt, -20 to -70 °C as supplied.
- 1 month, 2 to 8 °C under sterile conditions after reconstitution.
- 6 months, -20 to -70 °C under sterile conditions after reconstitution.
Calculators
Background: Akt
Additional Akt Products
Product Documents for Akt Pan Specific Antibody (281046)
Certificate of Analysis
To download a Certificate of Analysis, please enter a lot or batch number in the search box below.
Note: Certificate of Analysis not available for kit components.
Product Specific Notices for Akt Pan Specific Antibody (281046)
For research use only
Citations for Akt Pan Specific Antibody (281046)
 Powered by Bioz
Customer Reviews for Akt Pan Specific Antibody (281046) (3)
4.3 out of 5
3 Customer Ratings
Have you used Akt Pan Specific Antibody (281046)?
Submit a review and receive an Amazon gift card!
$25/€18/£15/$25CAN/¥2500 Yen for a review with an image
$10/€7/£6/$10CAN/¥1110 Yen for a review without an image
Submit a review
Customer Images

Showing
1
-
3 of
3 reviews
Showing All
Filter By:
-
Application: Western BlotSample Tested: PANC-1 human pancreatic carcinoma cell lineSpecies: HumanVerified Customer | Posted 01/12/2018

-
Application: Immunocytochemistry/ImmunofluorescenceSample Tested: Prostate tissueSpecies: HumanVerified Customer | Posted 11/03/2017
-
Application: Western BlotSample Tested: Cell lysate from HeLa cellsSpecies: HumanVerified Customer | Posted 12/12/2014Western blot for HeLa cells
There are no reviews that match your criteria.
Protocols
Find general support by application which include: protocols, troubleshooting, illustrated assays, videos and webinars.
- 7-Amino Actinomycin D (7-AAD) Cell Viability Flow Cytometry Protocol
- Antigen Retrieval Protocol (PIER)
- Antigen Retrieval for Frozen Sections Protocol
- Appropriate Fixation of IHC/ICC Samples
- Cellular Response to Hypoxia Protocols
- Chromogenic IHC Staining of Formalin-Fixed Paraffin-Embedded (FFPE) Tissue Protocol
- Chromogenic Immunohistochemistry Staining of Frozen Tissue
- ClariTSA™ Fluorophore Kits
- Detection & Visualization of Antibody Binding
- Extracellular Membrane Flow Cytometry Protocol
- Flow Cytometry Protocol for Cell Surface Markers
- Flow Cytometry Protocol for Staining Membrane Associated Proteins
- Flow Cytometry Staining Protocols
- Flow Cytometry Troubleshooting Guide
- Fluorescent IHC Staining of Frozen Tissue Protocol
- Graphic Protocol for Heat-induced Epitope Retrieval
- Graphic Protocol for the Preparation and Fluorescent IHC Staining of Frozen Tissue Sections
- Graphic Protocol for the Preparation and Fluorescent IHC Staining of Paraffin-embedded Tissue Sections
- Graphic Protocol for the Preparation of Gelatin-coated Slides for Histological Tissue Sections
- ICC Cell Smear Protocol for Suspension Cells
- ICC Immunocytochemistry Protocol Videos
- ICC for Adherent Cells
- IHC Sample Preparation (Frozen sections vs Paraffin)
- Immunocytochemistry (ICC) Protocol
- Immunocytochemistry Troubleshooting
- Immunofluorescence of Organoids Embedded in Cultrex Basement Membrane Extract
- Immunofluorescent IHC Staining of Formalin-Fixed Paraffin-Embedded (FFPE) Tissue Protocol
- Immunohistochemistry (IHC) and Immunocytochemistry (ICC) Protocols
- Immunohistochemistry Frozen Troubleshooting
- Immunohistochemistry Paraffin Troubleshooting
- Intracellular Flow Cytometry Protocol Using Alcohol (Methanol)
- Intracellular Flow Cytometry Protocol Using Detergents
- Intracellular Nuclear Staining Flow Cytometry Protocol Using Detergents
- Intracellular Staining Flow Cytometry Protocol Using Alcohol Permeabilization
- Intracellular Staining Flow Cytometry Protocol Using Detergents to Permeabilize Cells
- Preparing Samples for IHC/ICC Experiments
- Preventing Non-Specific Staining (Non-Specific Binding)
- Primary Antibody Selection & Optimization
- Propidium Iodide Cell Viability Flow Cytometry Protocol
- Protocol for Heat-Induced Epitope Retrieval (HIER)
- Protocol for Liperfluo
- Protocol for Making a 4% Formaldehyde Solution in PBS
- Protocol for VisUCyte™ HRP Polymer Detection Reagent
- Protocol for the Characterization of Human Th22 Cells
- Protocol for the Characterization of Human Th9 Cells
- Protocol for the Fluorescent ICC Staining of Cell Smears - Graphic
- Protocol for the Fluorescent ICC Staining of Cultured Cells on Coverslips - Graphic
- Protocol for the Preparation & Fixation of Cells on Coverslips
- Protocol for the Preparation and Chromogenic IHC Staining of Frozen Tissue Sections
- Protocol for the Preparation and Chromogenic IHC Staining of Frozen Tissue Sections - Graphic
- Protocol for the Preparation and Chromogenic IHC Staining of Paraffin-embedded Tissue Sections
- Protocol for the Preparation and Chromogenic IHC Staining of Paraffin-embedded Tissue Sections - Graphic
- Protocol for the Preparation and Fluorescent ICC Staining of Cells on Coverslips
- Protocol for the Preparation and Fluorescent ICC Staining of Non-adherent Cells
- Protocol for the Preparation and Fluorescent ICC Staining of Stem Cells on Coverslips
- Protocol for the Preparation and Fluorescent IHC Staining of Frozen Tissue Sections
- Protocol for the Preparation and Fluorescent IHC Staining of Paraffin-embedded Tissue Sections
- Protocol for the Preparation of Gelatin-coated Slides for Histological Tissue Sections
- Protocol for the Preparation of a Cell Smear for Non-adherent Cell ICC - Graphic
- Protocol: Annexin V and PI Staining by Flow Cytometry
- Protocol: Annexin V and PI Staining for Apoptosis by Flow Cytometry
- R&D Systems Quality Control Western Blot Protocol
- TUNEL and Active Caspase-3 Detection by IHC/ICC Protocol
- The Importance of IHC/ICC Controls
- Troubleshooting Guide: Fluorokine Flow Cytometry Kits
- Troubleshooting Guide: Immunohistochemistry
- Troubleshooting Guide: Western Blot Figures
- Western Blot Conditions
- Western Blot Protocol
- Western Blot Protocol for Cell Lysates
- Western Blot Troubleshooting
- Western Blot Troubleshooting Guide
- View all Protocols, Troubleshooting, Illustrated assays and Webinars
Loading...