Human Serum Albumin Antibody (188835)
R&D Systems | Catalog # MAB1455

Key Product Details
Validated by
Orthogonal Validation, Biological Validation
Species Reactivity
Validated:
Human
Cited:
Human, Mouse, Rat, Primate - Callithrix jacchus (Common Marmoset)
Applications
Validated:
Immunohistochemistry, Western Blot, Intracellular Staining by Flow Cytometry, Dual RNAscope ISH-IHC Compatible, Immunocytochemistry, Simple Western, CyTOF-ready
Cited:
Immunohistochemistry, Immunohistochemistry-Frozen, Western Blot, Flow Cytometry, Immunocytochemistry, Immunocytochemistry/ Immunofluorescence, ELISA Detection
Label
Unconjugated
Antibody Source
Monoclonal Mouse IgG2A Clone # 188835
Loading...
Product Specifications
Immunogen
Human Serum Albumin
Specificity
Detects human Serum Albumin in direct ELISAs and Western blots. Does not detect mouse Serum Albumin in direct ELISAs and Western blots.
Clonality
Monoclonal
Host
Mouse
Isotype
IgG2A
Scientific Data Images for Human Serum Albumin Antibody (188835)
Detection of Human Albumin by Western Blot.
Western blot shows lysate of human liver tissue. PVDF membrane was probed with 1 µg/mL of Mouse Anti-Human Serum Albumin Monoclonal Antibody (Catalog # MAB1455) followed by HRP-conjugated Anti-Mouse IgG Secondary Antibody (Catalog # HAF018). A specific band was detected for Albumin at approximately 65-70 kDa (as indicated). This experiment was conducted under reducing conditions and using Immunoblot Buffer Group 1.
Albumin in Hepatocytes Derived from Human Embryonic Stem Cells.
Albumin was detected in immersion fixed BG01V human embryonic stem cells differentiated to hepatocytes using Mouse Anti-Human Serum Albumin Monoclonal Antibody (Catalog # MAB1455) at 10 µg/mL for 3 hours at room temperature. Cells were stained using the NorthernLights™ 557-conjugated Anti-Mouse IgG Secondary Antibody (red; Catalog # NL007) and counterstained with DAPI (blue). Specific staining was localized to cytoplasm. Cells were co-stained using Sheep Anti-Human CEBP alpha (Catalog # AF7094) and NorthernLights™ 493-conjugated Anti-Sheep IgG Secondary Antibody (green, Catalog # NL012). View our protocol for Fluorescent ICC Staining of Cells on Coverslips.
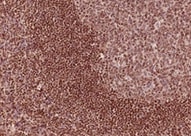
Albumin in Human Liver.
Albumin was detected in immersion fixed paraffin-embedded sections of human liver using Mouse Anti-Human Serum Albumin Monoclonal Antibody (Catalog # MAB1455) at 0.1 µg/mL for 1 hour at room temperature followed by incubation with the Anti-Mouse IgG VisUCyte™ HRP Polymer Antibody (Catalog # VC001). Before incubation with the primary antibody, tissue was subjected to heat-induced epitope retrieval using Antigen Retrieval Reagent-Basic (Catalog # CTS013). Tissue was stained using DAB (brown) and counterstained with hematoxylin (blue). Specific staining was localized to cytoplasm and plasma membrane. View our protocol for IHC Staining with VisUCyte HRP Polymer Detection Reagents.
Detection of Albumin in HepG2 Human Cell Line by Flow Cytometry.
HepG2 human hepatocellular carcinoma cell line was stained with Mouse Anti-Human Serum Albumin Monoclonal Antibody (Catalog # MAB1455, filled histogram) or isotype control antibody (Catalog # MAB003, open histogram), followed by Allophycocyanin-conjugated Anti-Mouse IgG Secondary Antibody (Catalog # F0101B). To facilitate intracellular staining, cells were fixed with paraformaldehyde and permeabilized with saponin.
Detection of Human Albumin by Simple WesternTM.
Simple Western lane view shows lysates of human serum, loaded at 1:25000. A specific band was detected for Albumin at approximately 64 kDa (as indicated) using 1 µg/mL of Mouse Anti-Human Serum Albumin Monoclonal Antibody (Catalog # MAB1455). This experiment was conducted under reducing conditions and using the 12-230 kDa separation system.
Detection of Human Albumin by Simple WesternTM.
Simple Western lane view shows lysates of human liver tissue, loaded at 0.2 mg/mL. A specific band was detected for Albumin at approximately 64 kDa (as indicated) using 10 µg/mL of Mouse Anti-Human Serum Albumin Monoclonal Antibody (Catalog # MAB1455). This experiment was conducted under reducing conditions and using the 12-230 kDa separation system.
Serum Albumin in Human Liver Using Dual RNAscope®ISH and IHC.
Serum Albumin mRNA was detected in formalin-fixed paraffin-embedded tissue sections of human liver probed with ACD RNAScope®Probe (Catalog # 600941) and stained using ACD RNAscope®2.5 HD Detection Reagents-Red (top image, Catalog # 32260). Adjacent tissue section was processed for immunohistochemistry using R&D Systems Mouse Anti-Human Serum Albumin Monoclonal Antibody (Catalog # MAB1455) at 0.05 ug/mL for 1 hour at room temperature followed by incubation with the Anti-Mouse IgG VisUCyte HRP Polymer Antibody (R&D Systems, Catalog # VC001) and DAB chromogen (lower image, yellow-brown). Tissues were counterstained with hematoxylin (blue).
Detection of Mouse Albumin by Immunohistochemistry
Heterochronic blood exchange effects on muscle regeneration and performance.One day after blood exchange mice were injured by intramuscular injections of CTX into TA. Five days after injury, TA muscles were isolated, cryo-sectioned and analysed. (a) TA muscles from young mice receiving young blood (YY), young mice receiving old blood (YO), old mice receiving young blood (OY) and old mice receiving old blood (OO) were analysed by haematoxylin and eosin (H&E) staining and immunofluorescence with anti-eMyHC antibody. Representative images show an injury site and nascent de-novo formed eMyHC+ myofibers which are smaller in size with central nuclei than uninjured myofibers. Scale bar, 50 μm for H&E panel and 25 μm for immunofluorescence panel. (b,c) Regeneration indices ±s.e.m. were quantified from H&E images (b) and eMyHC images (c) by counting the number of nascent de-novo formed myofibers and dividing by the total number of nuclei present at the injury/regeneration site. By H&E: *P<0.05 N=4 per group. Significant students t test differences exist between YO and OY (P=0.045), YY and OY (P=0.043), YY and OO (P=0.0004), YO and OO (P=0.0042) and between OY and OO (P=0.015). By eMyHC: *P<0.05, N=4 per group; OY and OO P=0.041, YY and OO P=0.00009, and YO to OO P=0.001. (d) Fibrotic/inflammatory indexes were quantified as total injury area minus regenerated myofiber area, per injury site, using the H&E images15. T-test **P<0.005, n=3–4 per group. Muscle from old to old isochronic exchange had diminished regenerative capacity and more fibrosis, as compared with muscle from young to young isochronic exchange. Heterochronic blood exchange significantly improved regeneration of old muscle after experimental injury and reduced fibrosis, but no significant decline in young muscle regeneration was seen. (e) A four-limb hanging test was conducted with isochronically and heterochronically transfused mice that were not injured, before and at 6 days after the blood exchange. Maximal h
Detection of Mouse Albumin by Immunohistochemistry
Heterochronic blood exchange effects on hepatogenesis and liver fibrosis and adiposity.(a) Livers from YY, YO, OY and OO mice with and without experimental muscle injury as above were cryo-sectioned at 10 μm and immuno-stained for Ki67 (red), hepatocyte marker albumin (green) and Hoechst (blue). Representative images show YY livers with and without injury. Scale bar, 50 μm. (B&C. Quantification of hepatocyte proliferation was by counting the average number of Ki67+,abumin+,Hoechst+ cells per 10 μm section from multiple sections of each blood exchange cohort. (b) Old hepatocyte showed increased proliferation and young hepatocytes showed less proliferation with heterochronic blood as compared with isochronic blood exchanges in animals with injured muscle (t test P=0.00028). (c) This trend continues without muscle injury, but the total numbers of proliferating hepatocytes decline by twofold, (P=0.02411). *P<0.05; **P<0.005; n=3–5. (d) As previously published4, there were fibrotic clusters exclusively in the old livers of small Ki67+ve, albumin negative Ki67+ cells. Scale bar, 50 μm, × 40 magnification. (e,f) Fibrotic index was calculated as the average number of albumin negative proliferative cell clusters per four 10 μm sections. The fibrotic index diminished in old mice exchanged with young blood with muscle injury (e) (t test P=0.048 N=4, *P<0.05) or without (f) (t test P=0.00776. N=3; **P<0.005). (g) Liver adiposity was assayed by Oil Red in 10 μm cryosections. Shown are representative images acquired at × 20 magnification. (h). Liver adiposity (red) was quantified by Image J, dramatically increased with age and was attenuated by young blood in old mice (t test N=3, P=0.022), while adiposity remained unchanged in young mice that were transfused with the old blood (see Supplementary Figure 4). Shown are means±s.e.m. for all histograms. Image collected and cropped by CiteAb from the following publication (https://pubmed.ncbi.nlm.nih.gov/27874859), licensed under a CC
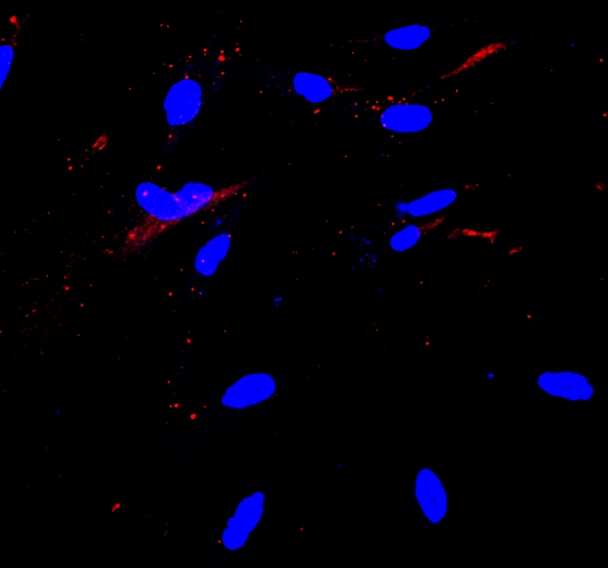
Detection of Human Albumin by Immunocytochemistry/Immunofluorescence
Differentiation of hESCs into HLCs.a The relative hepatocyte (ALB, AAT, CK18, and ASGPR1), cholangiocyte (SOX9), and hepatoblast (AFP) gene expression levels of day 19 differentiated cells with different treatments (groups A and B) were determined by qPCR. HGF (hepatocyte growth factor, 20 ng/mL); OSM (oncostatin M, 20 ng/mL); Dex (dexamethasone, 10 µM); SB431542 (TGF beta inhibitor, 2 µM); and RO4929097 (Notch inhibitor, 1 µM). b Immunofluorescence analysis of ALB, AAT, ASGPR1, and CK18 expression in group B-induced differentiated cells on day 19. c The expression levels of ALB and ASGPR1 in group B-induced differentiated cells were determined by flow cytometry on day 19. Isotype control antibodies were used as controls. d The relative hepatocyte (ALB, AAT, CK18, ASGPR1, and AFP) gene expression levels of differentiated HLCs (group B) compared with those of hESCs and primary human hepatocytes (PHHs) were determined by qPCR. e Albumin secretion of HLCs (black line) on days 12, 14, 16, 18, and 20 and PHHs (dotted line) on day 2 were determined by ELISA. *p < 0.05, **p < 0.01; data are represented as the mean ± SD. Scale bar, 50 µm Image collected and cropped by CiteAb from the following publication (https://pubmed.ncbi.nlm.nih.gov/31601782), licensed under a CC-BY license. Not internally tested by R&D Systems.
Detection of Human Albumin by Immunohistochemistry
NLRP3 inflammasome-dependent pyroptosis occurs in liver fibrosis. (A) IHC staining for GSDMD, IL-1 beta, and IL-18 in liver sections from liver fibrosis patients and HCs. Scale bar: 40 µm. (B–D) ELISA analyses of serum levels of GSDMD (B), IL-1 beta (C), and IL-18 (D) in liver fibrosis patients (n = 89) and HCs (n = 60). (E) Representative immunofluorescence images of NLRP3 (red) and albumin (hepatocyte marker) (top), F4/80 (KC marker) (middle) or alpha -SMA (HSC marker) (bottom) (green) from the human fibrotic liver tissues. Scale bar: 40 µm. (F) Schematic diagram of the study. Liver fibrosis was induced by CCl4 injection for 8 weeks. (G) Representative mouse liver histology of H&E, Sirius Red staining, and IHC staining for alpha -SMA, GSDMD, and IL-1 beta. Black scale bar: 100 µm; Red scale bar: 50 µm. (H–J) ELISA analyses for serum levels of GSDMD (H), IL-1 beta (I), and IL-18 (J) in CCl4 group mouse (n = 5) and vehicle group mouse (n = 5). (K) Representative immunofluorescence images of NLRP3 (red) and albumin (hepatocyte marker) (top), F4/80 (KC marker) (middle) or alpha -SMA (HSC marker) (bottom) (green) from the 8-week CCl4-treated mouse liver. The vehicle group mouse liver was used as a control. Scale bar: 40 µm. (L) The qRT-PCR analysis for mRNA levels of IL-1 beta in THP-1 macrophages treated with LPS to induce pyroptosis. (M) ELISA analysis for IL-1 beta expression in supernatants from THP-1. (N) Western blot analysis of COL1A1, alpha -SMA, and TGF-beta expression in LX-2 cells which were exposed to CM from LPS-treated THP-1 macrophages. The protein expression was quantified by densitometry and normalized to beta -actin and are shown as fold changes relative to the control group (right panel). ** p < 0.01, *** p < 0.001. Image collected and cropped by CiteAb from the following open publication (https://pubmed.ncbi.nlm.nih.gov/36429008), licensed under a CC-BY license. Not internally tested by R&D Systems.
Detection of Mouse Albumin by Immunohistochemistry
NLRP3 inflammasome-dependent pyroptosis occurs in liver fibrosis. (A) IHC staining for GSDMD, IL-1 beta, and IL-18 in liver sections from liver fibrosis patients and HCs. Scale bar: 40 µm. (B–D) ELISA analyses of serum levels of GSDMD (B), IL-1 beta (C), and IL-18 (D) in liver fibrosis patients (n = 89) and HCs (n = 60). (E) Representative immunofluorescence images of NLRP3 (red) and albumin (hepatocyte marker) (top), F4/80 (KC marker) (middle) or alpha -SMA (HSC marker) (bottom) (green) from the human fibrotic liver tissues. Scale bar: 40 µm. (F) Schematic diagram of the study. Liver fibrosis was induced by CCl4 injection for 8 weeks. (G) Representative mouse liver histology of H&E, Sirius Red staining, and IHC staining for alpha -SMA, GSDMD, and IL-1 beta. Black scale bar: 100 µm; Red scale bar: 50 µm. (H–J) ELISA analyses for serum levels of GSDMD (H), IL-1 beta (I), and IL-18 (J) in CCl4 group mouse (n = 5) and vehicle group mouse (n = 5). (K) Representative immunofluorescence images of NLRP3 (red) and albumin (hepatocyte marker) (top), F4/80 (KC marker) (middle) or alpha -SMA (HSC marker) (bottom) (green) from the 8-week CCl4-treated mouse liver. The vehicle group mouse liver was used as a control. Scale bar: 40 µm. (L) The qRT-PCR analysis for mRNA levels of IL-1 beta in THP-1 macrophages treated with LPS to induce pyroptosis. (M) ELISA analysis for IL-1 beta expression in supernatants from THP-1. (N) Western blot analysis of COL1A1, alpha -SMA, and TGF-beta expression in LX-2 cells which were exposed to CM from LPS-treated THP-1 macrophages. The protein expression was quantified by densitometry and normalized to beta -actin and are shown as fold changes relative to the control group (right panel). ** p < 0.01, *** p < 0.001. Image collected and cropped by CiteAb from the following open publication (https://pubmed.ncbi.nlm.nih.gov/36429008), licensed under a CC-BY license. Not internally tested by R&D Systems.
Immunofluorescent Staining of Adult Stem Cell-derived Liver Organoids.
Adult stem cell-derived liver organoids were generated following the steps detailed in the human liver organoid culture protocol. Differentiated human liver organoids were stained using a (A) Mouse Anti-Human Serum Albumin Monoclonal Antibody (Catalog # MAB1455; red) and a (B) Goat Anti-Human HNF-3beta Antigen Affinity-purified Polyclonal Antibody (Catalog # AF2400; red) and counterstained with DAPI (Catalog # 5748; blue).Applications for Human Serum Albumin Antibody (188835)
Application
Recommended Usage
CyTOF-ready
Ready to be labeled using established conjugation methods. No BSA or other carrier proteins that could interfere with conjugation.
Dual RNAscope ISH-IHC Compatible
0.05-25 µg/mL
Sample: Immersion fixed paraffin-embedded sections of human liver
Sample: Immersion fixed paraffin-embedded sections of human liver
Immunocytochemistry
8-25 µg/mL
Sample: Immersion fixed BG01V human embryonic stem cells differentiated to hepatocytes
Sample: Immersion fixed BG01V human embryonic stem cells differentiated to hepatocytes
Immunohistochemistry
0.1-25 µg/mL
Sample: Immersion fixed paraffin-embedded sections of human liver
Sample: Immersion fixed paraffin-embedded sections of human liver
Intracellular Staining by Flow Cytometry
0.25 µg/106 cells
Sample: HepG2 human hepatocellular carcinoma cell line fixed with paraformaldehyde and permeabilized with saponin
Sample: HepG2 human hepatocellular carcinoma cell line fixed with paraformaldehyde and permeabilized with saponin
Simple Western
1-10 µg/mL
Sample: Human liver tissue and Human serum
Sample: Human liver tissue and Human serum
Western Blot
0.2-1 µg/mL
Sample: Human liver tissue
Sample: Human liver tissue
Reviewed Applications
Read 5 reviews rated 4.4 using MAB1455 in the following applications:
Flow Cytometry Panel Builder
Bio-Techne Knows Flow Cytometry
Save time and reduce costly mistakes by quickly finding compatible reagents using the Panel Builder Tool.
Advanced Features
- Spectra Viewer - Custom analysis of spectra from multiple fluorochromes
- Spillover Popups - Visualize the spectra of individual fluorochromes
- Antigen Density Selector - Match fluorochrome brightness with antigen density

Formulation, Preparation, and Storage
Purification
Protein A or G purified from hybridoma culture supernatant
Reconstitution
Reconstitute at 0.5 mg/mL in sterile PBS. For liquid material, refer to CoA for concentration.
Loading...
Formulation
Lyophilized from a 0.2 μm filtered solution in PBS with Trehalose. *Small pack size (SP) is supplied either lyophilized or as a 0.2 µm filtered solution in PBS.
Shipping
Lyophilized product is shipped at ambient temperature. Liquid small pack size (-SP) is shipped with polar packs. Upon receipt, store immediately at the temperature recommended below.
Stability & Storage
Use a manual defrost freezer and avoid repeated freeze-thaw cycles.
- 12 months from date of receipt, -20 to -70 °C as supplied.
- 1 month, 2 to 8 °C under sterile conditions after reconstitution.
- 6 months, -20 to -70 °C under sterile conditions after reconstitution.
Calculators
Background: Albumin
Additional Albumin Products
Product Documents for Human Serum Albumin Antibody (188835)
Certificate of Analysis
To download a Certificate of Analysis, please enter a lot or batch number in the search box below.
Note: Certificate of Analysis not available for kit components.
Product Specific Notices for Human Serum Albumin Antibody (188835)
For research use only
Related Research Areas
Citations for Human Serum Albumin Antibody (188835)
 Powered by Bioz
Customer Reviews for Human Serum Albumin Antibody (188835) (5)
4.4 out of 5
5 Customer Ratings
Have you used Human Serum Albumin Antibody (188835)?
Submit a review and receive an Amazon gift card!
$25/€18/£15/$25CAN/¥2500 Yen for a review with an image
$10/€7/£6/$10CAN/¥1110 Yen for a review without an image
Submit a review
Customer Images
Showing
1
-
5 of
5 reviews
Showing All
Filter By:
-
Application: ImmunohistochemistrySample Tested: Tonsil tissueSpecies: HumanVerified Customer | Posted 08/20/2021

-
Application: ELISASample Tested: Human recombinant antibodySpecies: HumanVerified Customer | Posted 10/25/2017
-
Application: ImmunocytochemistrySample Tested: pig trabecular meshwork cellsSpecies: PigVerified Customer | Posted 12/05/2016Detection of Albumin in cultured pig trabecular meshwork cells using Human Serum Albumin Antibody (MAB1455) at 1:500 dilution overnight and donkey anti-mouse Alexa 594 (1:1000) for 1 hour.
-
Application: Flow CytometrySample Tested: See PMID 23072626Species: MouseVerified Customer | Posted 02/10/2015
-
Application: Flow CytometrySample Tested: See PMID 22829291Species: HumanVerified Customer | Posted 02/10/2015
There are no reviews that match your criteria.
Protocols
Find general support by application which include: protocols, troubleshooting, illustrated assays, videos and webinars.
- 7-Amino Actinomycin D (7-AAD) Cell Viability Flow Cytometry Protocol
- Antigen Retrieval Protocol (PIER)
- Antigen Retrieval for Frozen Sections Protocol
- Appropriate Fixation of IHC/ICC Samples
- Cellular Response to Hypoxia Protocols
- Chromogenic IHC Staining of Formalin-Fixed Paraffin-Embedded (FFPE) Tissue Protocol
- Chromogenic Immunohistochemistry Staining of Frozen Tissue
- ClariTSA™ Fluorophore Kits
- Detection & Visualization of Antibody Binding
- Extracellular Membrane Flow Cytometry Protocol
- Flow Cytometry Protocol for Cell Surface Markers
- Flow Cytometry Protocol for Staining Membrane Associated Proteins
- Flow Cytometry Staining Protocols
- Flow Cytometry Troubleshooting Guide
- Fluorescent IHC Staining of Frozen Tissue Protocol
- Graphic Protocol for Heat-induced Epitope Retrieval
- Graphic Protocol for the Preparation and Fluorescent IHC Staining of Frozen Tissue Sections
- Graphic Protocol for the Preparation and Fluorescent IHC Staining of Paraffin-embedded Tissue Sections
- Graphic Protocol for the Preparation of Gelatin-coated Slides for Histological Tissue Sections
- ICC Cell Smear Protocol for Suspension Cells
- ICC Immunocytochemistry Protocol Videos
- ICC for Adherent Cells
- IHC Sample Preparation (Frozen sections vs Paraffin)
- ISH-IHC Protocol for Chromogenic Detection on Formalin Fixed Paraffin Embedded (FFPE) Tissue
- Immunocytochemistry (ICC) Protocol
- Immunocytochemistry Troubleshooting
- Immunofluorescence of Organoids Embedded in Cultrex Basement Membrane Extract
- Immunofluorescent IHC Staining of Formalin-Fixed Paraffin-Embedded (FFPE) Tissue Protocol
- Immunohistochemistry (IHC) and Immunocytochemistry (ICC) Protocols
- Immunohistochemistry Frozen Troubleshooting
- Immunohistochemistry Paraffin Troubleshooting
- Intracellular Flow Cytometry Protocol Using Alcohol (Methanol)
- Intracellular Flow Cytometry Protocol Using Detergents
- Intracellular Nuclear Staining Flow Cytometry Protocol Using Detergents
- Intracellular Staining Flow Cytometry Protocol Using Alcohol Permeabilization
- Intracellular Staining Flow Cytometry Protocol Using Detergents to Permeabilize Cells
- Preparing Samples for IHC/ICC Experiments
- Preventing Non-Specific Staining (Non-Specific Binding)
- Primary Antibody Selection & Optimization
- Propidium Iodide Cell Viability Flow Cytometry Protocol
- Protocol for Heat-Induced Epitope Retrieval (HIER)
- Protocol for Liperfluo
- Protocol for Making a 4% Formaldehyde Solution in PBS
- Protocol for VisUCyte™ HRP Polymer Detection Reagent
- Protocol for the Characterization of Human Th22 Cells
- Protocol for the Characterization of Human Th9 Cells
- Protocol for the Fluorescent ICC Staining of Cell Smears - Graphic
- Protocol for the Fluorescent ICC Staining of Cultured Cells on Coverslips - Graphic
- Protocol for the Preparation & Fixation of Cells on Coverslips
- Protocol for the Preparation and Chromogenic IHC Staining of Frozen Tissue Sections
- Protocol for the Preparation and Chromogenic IHC Staining of Frozen Tissue Sections - Graphic
- Protocol for the Preparation and Chromogenic IHC Staining of Paraffin-embedded Tissue Sections
- Protocol for the Preparation and Chromogenic IHC Staining of Paraffin-embedded Tissue Sections - Graphic
- Protocol for the Preparation and Fluorescent ICC Staining of Cells on Coverslips
- Protocol for the Preparation and Fluorescent ICC Staining of Non-adherent Cells
- Protocol for the Preparation and Fluorescent ICC Staining of Stem Cells on Coverslips
- Protocol for the Preparation and Fluorescent IHC Staining of Frozen Tissue Sections
- Protocol for the Preparation and Fluorescent IHC Staining of Paraffin-embedded Tissue Sections
- Protocol for the Preparation of Gelatin-coated Slides for Histological Tissue Sections
- Protocol for the Preparation of a Cell Smear for Non-adherent Cell ICC - Graphic
- Protocol: Annexin V and PI Staining by Flow Cytometry
- Protocol: Annexin V and PI Staining for Apoptosis by Flow Cytometry
- R&D Systems Quality Control Western Blot Protocol
- TUNEL and Active Caspase-3 Detection by IHC/ICC Protocol
- The Importance of IHC/ICC Controls
- Troubleshooting Guide: Fluorokine Flow Cytometry Kits
- Troubleshooting Guide: Immunohistochemistry
- Troubleshooting Guide: Western Blot Figures
- Western Blot Conditions
- Western Blot Protocol
- Western Blot Protocol for Cell Lysates
- Western Blot Troubleshooting
- Western Blot Troubleshooting Guide
- View all Protocols, Troubleshooting, Illustrated assays and Webinars
FAQs for Human Serum Albumin Antibody (188835)
Showing
1
-
1 of
1 FAQ
Showing All
-
Q: What is the light chain of Human Serum Albumin Antibody, Catalog #s MAB1455 and IC1455, Clone #188835?
A: Catalog #s MAB1455 and IC1455 have a kappa light chain.
Loading...
Associated Pathways
