Rat IL-1 beta/IL-1F2 Antibody
R&D Systems | Catalog # AF-501-NA

Key Product Details
Validated by
Biological Validation
Species Reactivity
Validated:
Rat
Cited:
Mouse, Rat
Applications
Validated:
Western Blot, ELISA Capture (Matched Antibody Pair), Neutralization, Immunocytochemistry
Cited:
Immunohistochemistry, Immunohistochemistry-Paraffin, Immunohistochemistry-Frozen, Western Blot, Neutralization, Immunocytochemistry, ELISA Development, ELISA Development (Capture)
Label
Unconjugated
Antibody Source
Polyclonal Goat IgG
Loading...
Product Specifications
Immunogen
E. coli-derived recombinant rat IL-1 beta /IL-1F2 (R&D Systems, Catalog # 501-RL)
Val117-Ser268
Accession # Q63264
Val117-Ser268
Accession # Q63264
Specificity
Detects rat IL-1 beta /IL-1F2 in ELISAs and Western blots. In sandwich immunoassays, less than 1% cross-reactivity with recombinant mouse IL‑1 beta is observed and less than 0.5% cross-reactivity with recombinant human IL-1 beta and recombinant porcine IL-1 beta is observed.
Clonality
Polyclonal
Host
Goat
Isotype
IgG
Endotoxin Level
<0.10 EU per 1 μg of the antibody by the LAL method.
Scientific Data Images for Rat IL-1 beta/IL-1F2 Antibody
Cell Proliferation Induced by IL‑1 beta /IL‑1F2 and Neutralization by Rat IL‑1 beta /IL‑1F2 Antibody.
Recombinant Rat IL-1 beta /IL-1F2 (Catalog # 501-RL) stimulates proliferation in the the D10.G4.1 mouse helper T cell line in a dose-dependent manner (orange line). Proliferation elicited by Recombinant Rat IL-1 beta /IL-1F2 (10 ng/mL) is neutralized (green line) by increasing concentrations of Rat IL-1 beta /IL-1F2 Antigen Affinity-purified Polyclonal Antibody (Catalog # AF-501-NA). The ND50 is typically 2-10 µg/mL.
IL‑1 beta /IL‑1F2 in Rat Splenocytes.
IL‑1 beta /IL‑1F2 was detected in immersion fixed LPS-stimulated rat splenocytes using 5 µg/mL Rat IL‑1 beta /IL‑1F2 Antigen Affinity-purified Polyclonal Antibody (Catalog # AF‑501‑NA) for 3 hours at room temperature. Cells were stained with the NorthernLights™ 557-conjugated Anti-Goat IgG Secondary Antibody (red; Catalog # NL001) and counterstained (green). View our protocol for Fluorescent ICC Staining of Non-adherent Cells.
Detection of Porcine IL-1 beta/IL-1F2 by Immunocytochemistry/ Immunofluorescence
Spatiotemporal analysis of retinal Il-1 beta protein levels following LD.A-G: Immunohistochemical assessment of Il-1 beta expression (green) in retinal cryosections over the course of LD. A: Immunoreactivity (IR) for Il-1 beta protein was not observed in dim-reared animals. B-D: Il-1 beta -IR was present among ramified nuclei situated within the ONL and OS (arrowheads) immediately following exposure to 24hrs LD. E-F: Il-1 beta -IR co-localised with IBA1+ cells (red) situated in the ONL/OS, though was not apparent in IBA1+ cells outside the vicinity of the ONL (asterisks). G-H: Il-1 beta -expressing cells (H, arrowheads) did not show any discernible IR for the M2 marker CD206 (red). I: Negative control sections, in which the primary antibody was omitted, did not show any resemblance to the IR for Il-1 beta evidenced in C-D at 24hrs LD. J: ELISA for Il-1 beta protein indicated an increased abundance of the protein immediately after 24hrs LD (P<0.05), and which was virtually undetectable at all other time points. C, choroid; GCL, ganglion cell layer; INL, inner nuclear layer; IHC, immunohistochemistry; ONL, outer nuclear layer; OS, outer segments; RPE, retinal pigment epithelium. The trend in ELISA protein levels was significant by ANOVA (P < 0.05); N = 3 for each timepoint. Image collected and cropped by CiteAb from the following open publication (https://pubmed.ncbi.nlm.nih.gov/26630454), licensed under a CC-BY license. Not internally tested by R&D Systems.
Detection of Porcine IL-1 beta/IL-1F2 by Immunocytochemistry/ Immunofluorescence
Spatiotemporal analysis of retinal CD206 protein levels following LD.A-L: investigation of CD206 immunoreactivity (IR, green) in retinal cryosections over the course of LD. A-B: In dim-reared animals, immunoreactivity (IR) for Il-1 beta protein was occasionally observed within nuclei (arrowheads) amongst the choroid (A) and ciliary body (B). C-E: Following 24hrs LD, CD206+ nuclei appeared from the ciliary body (C-D, arrowheads) and among the superficial retinal vasculature (E, arrowhead) F: At 24hrs LD, CD206+ cells were also more abundant within the ciliary body (arrowheads). G-I: There was increased abundance of CD206+ nuclei among optic nerve head (G-H) and superficial retinal vasculature (I) after 3 days post-exposure (arrowheads), compared to 24hrs LD. J: CD206+ cells were occasionally found accumulating within the choroid at 7 days post-exposure (arrowheads). K-L: All IR for CD206 was found to correlate with circular IBA1+ cells (red). M-N: CD206-expressing cells (N, arrowhead) did not show any detectable IR for the M1 marker Il-1 beta (red). O: Quantification of CD206 protein levels in retinas via ELISA. At 3 and 7 days post-exposure, the levels of CD206 protein were significantly higher compared to dim-reared controls (P<0.05). Progressive increases were observed during the post-exposure period, though this was not significant between 3 and 7 days (P>0.05). C, choroid; GCL, ganglion cell layer; INL, inner nuclear layer; IPL, inner plexiform layer; IHC, immunohistochemistry; ONL, outer nuclear layer; OS, outer segments; RPE, retinal pigment epithelium. The trend in ELISA protein levels was significant by ANOVA (P < 0.05); N = 3 for each timepoint. Image collected and cropped by CiteAb from the following open publication (https://pubmed.ncbi.nlm.nih.gov/26630454), licensed under a CC-BY license. Not internally tested by R&D Systems.
Detection of Porcine IL-1 beta/IL-1F2 by Flow Cytometry
Correlation of CD206 and Il-1 beta immunolabelling within the CD11b+ macrophage population following LD.A: Representative flow cytometry plots examine CD206+ and Il1b+ cell counts within the CD11b population following light damage. For the most part, Il-1 beta and CD206 cells occupied mutually distinct subsets within the population CD11b cells. B: Quantification of Il-1 beta +/CD206- and CD206+/Il-1 beta - cells as percentage of the CD11b+ population following LD. There was a sharp increase in the proportion of Il-1 beta +/CD206- cells immediately following 24hrs LD (P<0.05), though this then decreased dramatically afterward and was similar to control samples by 7 days (P>0.05). For CD206+/Il-1 beta - cells, there was no change in their proportion at 24hrs LD (P>0.05). At 3 days post-exposure however the proportion of CD206+/Il-1 beta - cells had tripled (P<0.05), though this was then reduced to near control proportions by 7 days post-exposure (P<0.05). The trend of both Il-1 beta +/CD206- and CD206+/Il-1 beta - cells across the time course were significant by ANOVA (P < 0.05); N = 5 for each timepoint. Image collected and cropped by CiteAb from the following open publication (https://pubmed.ncbi.nlm.nih.gov/26630454), licensed under a CC-BY license. Not internally tested by R&D Systems.
Detection of Porcine IL-1 beta/IL-1F2 by Immunocytochemistry/ Immunofluorescence
Spatiotemporal analysis of retinal Il-1 beta protein levels following LD.A-G: Immunohistochemical assessment of Il-1 beta expression (green) in retinal cryosections over the course of LD. A: Immunoreactivity (IR) for Il-1 beta protein was not observed in dim-reared animals. B-D: Il-1 beta -IR was present among ramified nuclei situated within the ONL and OS (arrowheads) immediately following exposure to 24hrs LD. E-F: Il-1 beta -IR co-localised with IBA1+ cells (red) situated in the ONL/OS, though was not apparent in IBA1+ cells outside the vicinity of the ONL (asterisks). G-H: Il-1 beta -expressing cells (H, arrowheads) did not show any discernible IR for the M2 marker CD206 (red). I: Negative control sections, in which the primary antibody was omitted, did not show any resemblance to the IR for Il-1 beta evidenced in C-D at 24hrs LD. J: ELISA for Il-1 beta protein indicated an increased abundance of the protein immediately after 24hrs LD (P<0.05), and which was virtually undetectable at all other time points. C, choroid; GCL, ganglion cell layer; INL, inner nuclear layer; IHC, immunohistochemistry; ONL, outer nuclear layer; OS, outer segments; RPE, retinal pigment epithelium. The trend in ELISA protein levels was significant by ANOVA (P < 0.05); N = 3 for each timepoint. Image collected and cropped by CiteAb from the following open publication (https://pubmed.ncbi.nlm.nih.gov/26630454), licensed under a CC-BY license. Not internally tested by R&D Systems.
Detection of Porcine IL-1 beta/IL-1F2 by Immunocytochemistry/ Immunofluorescence
Spatiotemporal analysis of retinal CD206 protein levels following LD.A-L: investigation of CD206 immunoreactivity (IR, green) in retinal cryosections over the course of LD. A-B: In dim-reared animals, immunoreactivity (IR) for Il-1 beta protein was occasionally observed within nuclei (arrowheads) amongst the choroid (A) and ciliary body (B). C-E: Following 24hrs LD, CD206+ nuclei appeared from the ciliary body (C-D, arrowheads) and among the superficial retinal vasculature (E, arrowhead) F: At 24hrs LD, CD206+ cells were also more abundant within the ciliary body (arrowheads). G-I: There was increased abundance of CD206+ nuclei among optic nerve head (G-H) and superficial retinal vasculature (I) after 3 days post-exposure (arrowheads), compared to 24hrs LD. J: CD206+ cells were occasionally found accumulating within the choroid at 7 days post-exposure (arrowheads). K-L: All IR for CD206 was found to correlate with circular IBA1+ cells (red). M-N: CD206-expressing cells (N, arrowhead) did not show any detectable IR for the M1 marker Il-1 beta (red). O: Quantification of CD206 protein levels in retinas via ELISA. At 3 and 7 days post-exposure, the levels of CD206 protein were significantly higher compared to dim-reared controls (P<0.05). Progressive increases were observed during the post-exposure period, though this was not significant between 3 and 7 days (P>0.05). C, choroid; GCL, ganglion cell layer; INL, inner nuclear layer; IPL, inner plexiform layer; IHC, immunohistochemistry; ONL, outer nuclear layer; OS, outer segments; RPE, retinal pigment epithelium. The trend in ELISA protein levels was significant by ANOVA (P < 0.05); N = 3 for each timepoint. Image collected and cropped by CiteAb from the following open publication (https://pubmed.ncbi.nlm.nih.gov/26630454), licensed under a CC-BY license. Not internally tested by R&D Systems.
Detection of Porcine IL-1 beta/IL-1F2 by Immunocytochemistry/ Immunofluorescence
Spatiotemporal analysis of retinal Il-1 beta protein levels following LD.A-G: Immunohistochemical assessment of Il-1 beta expression (green) in retinal cryosections over the course of LD. A: Immunoreactivity (IR) for Il-1 beta protein was not observed in dim-reared animals. B-D: Il-1 beta -IR was present among ramified nuclei situated within the ONL and OS (arrowheads) immediately following exposure to 24hrs LD. E-F: Il-1 beta -IR co-localised with IBA1+ cells (red) situated in the ONL/OS, though was not apparent in IBA1+ cells outside the vicinity of the ONL (asterisks). G-H: Il-1 beta -expressing cells (H, arrowheads) did not show any discernible IR for the M2 marker CD206 (red). I: Negative control sections, in which the primary antibody was omitted, did not show any resemblance to the IR for Il-1 beta evidenced in C-D at 24hrs LD. J: ELISA for Il-1 beta protein indicated an increased abundance of the protein immediately after 24hrs LD (P<0.05), and which was virtually undetectable at all other time points. C, choroid; GCL, ganglion cell layer; INL, inner nuclear layer; IHC, immunohistochemistry; ONL, outer nuclear layer; OS, outer segments; RPE, retinal pigment epithelium. The trend in ELISA protein levels was significant by ANOVA (P < 0.05); N = 3 for each timepoint. Image collected and cropped by CiteAb from the following open publication (https://pubmed.ncbi.nlm.nih.gov/26630454), licensed under a CC-BY license. Not internally tested by R&D Systems.
Detection of Porcine IL-1 beta/IL-1F2 by Immunocytochemistry/ Immunofluorescence
Spatiotemporal analysis of retinal Il-1 beta protein levels following LD.A-G: Immunohistochemical assessment of Il-1 beta expression (green) in retinal cryosections over the course of LD. A: Immunoreactivity (IR) for Il-1 beta protein was not observed in dim-reared animals. B-D: Il-1 beta -IR was present among ramified nuclei situated within the ONL and OS (arrowheads) immediately following exposure to 24hrs LD. E-F: Il-1 beta -IR co-localised with IBA1+ cells (red) situated in the ONL/OS, though was not apparent in IBA1+ cells outside the vicinity of the ONL (asterisks). G-H: Il-1 beta -expressing cells (H, arrowheads) did not show any discernible IR for the M2 marker CD206 (red). I: Negative control sections, in which the primary antibody was omitted, did not show any resemblance to the IR for Il-1 beta evidenced in C-D at 24hrs LD. J: ELISA for Il-1 beta protein indicated an increased abundance of the protein immediately after 24hrs LD (P<0.05), and which was virtually undetectable at all other time points. C, choroid; GCL, ganglion cell layer; INL, inner nuclear layer; IHC, immunohistochemistry; ONL, outer nuclear layer; OS, outer segments; RPE, retinal pigment epithelium. The trend in ELISA protein levels was significant by ANOVA (P < 0.05); N = 3 for each timepoint. Image collected and cropped by CiteAb from the following open publication (https://pubmed.ncbi.nlm.nih.gov/26630454), licensed under a CC-BY license. Not internally tested by R&D Systems.
Detection of Porcine IL-1 beta/IL-1F2 by Western Blot
The effect of chronic clomipramine treatment on the hippocampal NLRP3 inflammasome level in the CMS-treated rats.The protein levels of A IL-1 beta, B cleaved caspase-1, C NLRP3, D ASC, and E pro-caspase-1 (n = 4/group) were analyzed by western blot. All data are expressed as the mean ± SD. ##p < 0.01, ###p < 0.001 compared to saline-treated rats. *p < 0.05, **p <0.01, ***p < 0.001 compared to non-stressed control rats. Image collected and cropped by CiteAb from the following open publication (https://pubmed.ncbi.nlm.nih.gov/35688836), licensed under a CC-BY license. Not internally tested by R&D Systems.
Detection of Porcine IL-1 beta/IL-1F2 by Immunocytochemistry/ Immunofluorescence
Spatiotemporal analysis of retinal Il-1 beta protein levels following LD.A-G: Immunohistochemical assessment of Il-1 beta expression (green) in retinal cryosections over the course of LD. A: Immunoreactivity (IR) for Il-1 beta protein was not observed in dim-reared animals. B-D: Il-1 beta -IR was present among ramified nuclei situated within the ONL and OS (arrowheads) immediately following exposure to 24hrs LD. E-F: Il-1 beta -IR co-localised with IBA1+ cells (red) situated in the ONL/OS, though was not apparent in IBA1+ cells outside the vicinity of the ONL (asterisks). G-H: Il-1 beta -expressing cells (H, arrowheads) did not show any discernible IR for the M2 marker CD206 (red). I: Negative control sections, in which the primary antibody was omitted, did not show any resemblance to the IR for Il-1 beta evidenced in C-D at 24hrs LD. J: ELISA for Il-1 beta protein indicated an increased abundance of the protein immediately after 24hrs LD (P<0.05), and which was virtually undetectable at all other time points. C, choroid; GCL, ganglion cell layer; INL, inner nuclear layer; IHC, immunohistochemistry; ONL, outer nuclear layer; OS, outer segments; RPE, retinal pigment epithelium. The trend in ELISA protein levels was significant by ANOVA (P < 0.05); N = 3 for each timepoint. Image collected and cropped by CiteAb from the following open publication (https://pubmed.ncbi.nlm.nih.gov/26630454), licensed under a CC-BY license. Not internally tested by R&D Systems.
Detection of Porcine IL-1 beta/IL-1F2 by Immunocytochemistry/ Immunofluorescence
Spatiotemporal analysis of retinal CD206 protein levels following LD.A-L: investigation of CD206 immunoreactivity (IR, green) in retinal cryosections over the course of LD. A-B: In dim-reared animals, immunoreactivity (IR) for Il-1 beta protein was occasionally observed within nuclei (arrowheads) amongst the choroid (A) and ciliary body (B). C-E: Following 24hrs LD, CD206+ nuclei appeared from the ciliary body (C-D, arrowheads) and among the superficial retinal vasculature (E, arrowhead) F: At 24hrs LD, CD206+ cells were also more abundant within the ciliary body (arrowheads). G-I: There was increased abundance of CD206+ nuclei among optic nerve head (G-H) and superficial retinal vasculature (I) after 3 days post-exposure (arrowheads), compared to 24hrs LD. J: CD206+ cells were occasionally found accumulating within the choroid at 7 days post-exposure (arrowheads). K-L: All IR for CD206 was found to correlate with circular IBA1+ cells (red). M-N: CD206-expressing cells (N, arrowhead) did not show any detectable IR for the M1 marker Il-1 beta (red). O: Quantification of CD206 protein levels in retinas via ELISA. At 3 and 7 days post-exposure, the levels of CD206 protein were significantly higher compared to dim-reared controls (P<0.05). Progressive increases were observed during the post-exposure period, though this was not significant between 3 and 7 days (P>0.05). C, choroid; GCL, ganglion cell layer; INL, inner nuclear layer; IPL, inner plexiform layer; IHC, immunohistochemistry; ONL, outer nuclear layer; OS, outer segments; RPE, retinal pigment epithelium. The trend in ELISA protein levels was significant by ANOVA (P < 0.05); N = 3 for each timepoint. Image collected and cropped by CiteAb from the following open publication (https://pubmed.ncbi.nlm.nih.gov/26630454), licensed under a CC-BY license. Not internally tested by R&D Systems.
Detection of Porcine IL-1 beta/IL-1F2 by Immunocytochemistry/ Immunofluorescence
Spatiotemporal analysis of retinal Il-1 beta protein levels following LD.A-G: Immunohistochemical assessment of Il-1 beta expression (green) in retinal cryosections over the course of LD. A: Immunoreactivity (IR) for Il-1 beta protein was not observed in dim-reared animals. B-D: Il-1 beta -IR was present among ramified nuclei situated within the ONL and OS (arrowheads) immediately following exposure to 24hrs LD. E-F: Il-1 beta -IR co-localised with IBA1+ cells (red) situated in the ONL/OS, though was not apparent in IBA1+ cells outside the vicinity of the ONL (asterisks). G-H: Il-1 beta -expressing cells (H, arrowheads) did not show any discernible IR for the M2 marker CD206 (red). I: Negative control sections, in which the primary antibody was omitted, did not show any resemblance to the IR for Il-1 beta evidenced in C-D at 24hrs LD. J: ELISA for Il-1 beta protein indicated an increased abundance of the protein immediately after 24hrs LD (P<0.05), and which was virtually undetectable at all other time points. C, choroid; GCL, ganglion cell layer; INL, inner nuclear layer; IHC, immunohistochemistry; ONL, outer nuclear layer; OS, outer segments; RPE, retinal pigment epithelium. The trend in ELISA protein levels was significant by ANOVA (P < 0.05); N = 3 for each timepoint. Image collected and cropped by CiteAb from the following open publication (https://pubmed.ncbi.nlm.nih.gov/26630454), licensed under a CC-BY license. Not internally tested by R&D Systems.
Detection of Porcine IL-1 beta/IL-1F2 by Immunocytochemistry/ Immunofluorescence
Spatiotemporal analysis of retinal Il-1 beta protein levels following LD.A-G: Immunohistochemical assessment of Il-1 beta expression (green) in retinal cryosections over the course of LD. A: Immunoreactivity (IR) for Il-1 beta protein was not observed in dim-reared animals. B-D: Il-1 beta -IR was present among ramified nuclei situated within the ONL and OS (arrowheads) immediately following exposure to 24hrs LD. E-F: Il-1 beta -IR co-localised with IBA1+ cells (red) situated in the ONL/OS, though was not apparent in IBA1+ cells outside the vicinity of the ONL (asterisks). G-H: Il-1 beta -expressing cells (H, arrowheads) did not show any discernible IR for the M2 marker CD206 (red). I: Negative control sections, in which the primary antibody was omitted, did not show any resemblance to the IR for Il-1 beta evidenced in C-D at 24hrs LD. J: ELISA for Il-1 beta protein indicated an increased abundance of the protein immediately after 24hrs LD (P<0.05), and which was virtually undetectable at all other time points. C, choroid; GCL, ganglion cell layer; INL, inner nuclear layer; IHC, immunohistochemistry; ONL, outer nuclear layer; OS, outer segments; RPE, retinal pigment epithelium. The trend in ELISA protein levels was significant by ANOVA (P < 0.05); N = 3 for each timepoint. Image collected and cropped by CiteAb from the following open publication (https://pubmed.ncbi.nlm.nih.gov/26630454), licensed under a CC-BY license. Not internally tested by R&D Systems.
Detection of Porcine IL-1 beta/IL-1F2 by Immunocytochemistry/ Immunofluorescence
Sustained IL-1 beta up-regulation in hippocampal astrocytes.IL-1 beta immunoreactivity was measured in GFAP-positive cells after LPS exposure or saline. Levels of IL-1 beta were found up-regulated from day 1 up to day 30. Higher magnification insets highlight the co-localization of IL-1 beta with GFAP (A). The ratio of IL-1 beta positive astrocytes in total astrocytes (GFAP positive cells) was quantified (B). Pictures show DG area, data are expressed as mean ± standard error of the mean (n = 4) and compared by 1-way analysis of variance followed with Boferroni post hoc analysis, **p<0.01, ***p<0.001 vs Control. Image collected and cropped by CiteAb from the following open publication (https://dx.plos.org/10.1371/journal.pone.0106331), licensed under a CC-BY license. Not internally tested by R&D Systems.
Detection of Rat IL-1 beta/IL-1F2 by Immunocytochemistry/ Immunofluorescence
Sustained IL-1 beta up-regulation in hippocampal astrocytes.IL-1 beta immunoreactivity was measured in GFAP-positive cells after LPS exposure or saline. Levels of IL-1 beta were found up-regulated from day 1 up to day 30. Higher magnification insets highlight the co-localization of IL-1 beta with GFAP (A). The ratio of IL-1 beta positive astrocytes in total astrocytes (GFAP positive cells) was quantified (B). Pictures show DG area, data are expressed as mean ± standard error of the mean (n = 4) and compared by 1-way analysis of variance followed with Boferroni post hoc analysis, **p<0.01, ***p<0.001 vs Control. Image collected and cropped by CiteAb from the following open publication (https://dx.plos.org/10.1371/journal.pone.0106331), licensed under a CC-BY license. Not internally tested by R&D Systems.
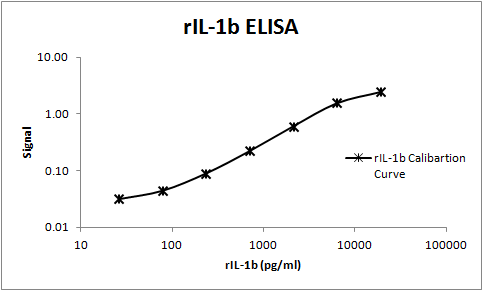
Rat IL-1 beta / IL-1F2 ELISA Standard Curve
Recombinant Rat IL‑1 beta /IL‑1F2 (Catalog # 501-RL) was serially diluted and captured by Goat Anti-Rat IL‑1 beta /IL‑1F2 Antigen Affinity-purified Polyclonal Antibody (Catalog # AF-501-NA) coated on a Clear Polystyrene Microplate (Catalog # DY990). Goat Anti-Rat IL‑1 beta /IL‑1F2 Antigen Affinity-purified Polyclonal Antibody (Catalog # AF-501-NA) was biotinylated and incubated with the protein captured on the plate. Detection of the standard curve was achieved by incubating Streptavidin-HRP (Catalog # DY998)
Rat IL-1 beta / IL-1F2 ELISA Standard Curve
Recombinant Rat IL‑1 beta /IL‑1F2 (Catalog # 501-RL) was serially diluted and captured by Goat Anti-Rat IL‑1 beta /IL‑1F2 Antigen Affinity-purified Polyclonal Antibody (Catalog # AF-501-NA) coated on a Clear Polystyrene Microplate (Catalog # DY990). Goat Anti-Rat IL‑1 beta /IL‑1F2 Antigen Affinity-purified Polyclonal Antibody (Catalog # AF-501-NA) was biotinylated and incubated with the protein captured on the plate. Detection of the standard curve was achieved by incubating Streptavidin-HRP (Catalog # DY998)Applications for Rat IL-1 beta/IL-1F2 Antibody
Application
Recommended Usage
Immunocytochemistry
5-15 µg/mL
Sample: Immersion fixed LPS-stimulated rat splenocytes
Sample: Immersion fixed LPS-stimulated rat splenocytes
Western Blot
0.1 µg/mL
Sample: Recombinant Rat IL‑1 beta /IL‑1F2 (Catalog # 501-RL)
Sample: Recombinant Rat IL‑1 beta /IL‑1F2 (Catalog # 501-RL)
Neutralization
Measured by its ability to neutralize IL‑1 beta /IL‑1F2-induced proliferation in the D10.G4.1 mouse helper T cell line. Symons, J.A. et al. (1987) in Lymphokines and Interferons, a Practical Approach. Clemens, M.J. et al. (eds): IRL Press. 272. The Neutralization Dose (ND50) is typically 2-10 µg/mL in the presence of 10 ng/mL Recombinant Rat IL‑1 beta /IL‑1F2.
Rat IL-1 beta /IL-1F2 Sandwich Immunoassay
Please Note: Optimal dilutions of this antibody should be experimentally determined.
Reviewed Applications
Read 1 review rated 5 using AF-501-NA in the following applications:
Formulation, Preparation, and Storage
Purification
Antigen Affinity-purified
Reconstitution
Reconstitute at 0.2 mg/mL in sterile PBS. For liquid material, refer to CoA for concentration.
Loading...
Formulation
Lyophilized from a 0.2 μm filtered solution in PBS with Trehalose. *Small pack size (SP) is supplied either lyophilized or as a 0.2 µm filtered solution in PBS.
Shipping
Lyophilized product is shipped at ambient temperature. Liquid small pack size (-SP) is shipped with polar packs. Upon receipt, store immediately at the temperature recommended below.
Stability & Storage
Use a manual defrost freezer and avoid repeated freeze-thaw cycles.
- 12 months from date of receipt, -20 to -70 °C as supplied.
- 1 month, 2 to 8 °C under sterile conditions after reconstitution.
- 6 months, -20 to -70 °C under sterile conditions after reconstitution.
Calculators
Background: IL-1 beta/IL-1F2
Long Name
Interleukin 1 beta
Alternate Names
IL-1b, IL-1F2, IL1 beta, IL1B
Entrez Gene IDs
Gene Symbol
IL1B
UniProt
Additional IL-1 beta/IL-1F2 Products
Product Documents for Rat IL-1 beta/IL-1F2 Antibody
Certificate of Analysis
To download a Certificate of Analysis, please enter a lot or batch number in the search box below.
Note: Certificate of Analysis not available for kit components.
Product Specific Notices for Rat IL-1 beta/IL-1F2 Antibody
For research use only
Related Research Areas
Citations for Rat IL-1 beta/IL-1F2 Antibody
 Powered by Bioz
Customer Reviews for Rat IL-1 beta/IL-1F2 Antibody (1)
5 out of 5
1 Customer Rating
Have you used Rat IL-1 beta/IL-1F2 Antibody?
Submit a review and receive an Amazon gift card!
$25/€18/£15/$25CAN/¥2500 Yen for a review with an image
$10/€7/£6/$10CAN/¥1110 Yen for a review without an image
Submit a review
Customer Images
Showing
1
-
1 of
1 review
Showing All
Filter By:
-
Application: ELISASample Tested: SerumSpecies: RatVerified Customer | Posted 11/07/2017This polyclonal antibody was used as both a capture and detection (the biotinylated version of this antibody, BAF501, was used as the detection) in a sandwich ELISA. Rat IL-1b was successful measured in serum samples.

There are no reviews that match your criteria.
Protocols
Find general support by application which include: protocols, troubleshooting, illustrated assays, videos and webinars.
- Appropriate Fixation of IHC/ICC Samples
- Cellular Response to Hypoxia Protocols
- ClariTSA™ Fluorophore Kits
- Detection & Visualization of Antibody Binding
- ICC Cell Smear Protocol for Suspension Cells
- ICC Immunocytochemistry Protocol Videos
- ICC for Adherent Cells
- Immunocytochemistry (ICC) Protocol
- Immunocytochemistry Troubleshooting
- Immunofluorescence of Organoids Embedded in Cultrex Basement Membrane Extract
- Immunohistochemistry (IHC) and Immunocytochemistry (ICC) Protocols
- Preparing Samples for IHC/ICC Experiments
- Preventing Non-Specific Staining (Non-Specific Binding)
- Primary Antibody Selection & Optimization
- Protocol for VisUCyte™ HRP Polymer Detection Reagent
- Protocol for the Fluorescent ICC Staining of Cell Smears - Graphic
- Protocol for the Fluorescent ICC Staining of Cultured Cells on Coverslips - Graphic
- Protocol for the Preparation and Fluorescent ICC Staining of Cells on Coverslips
- Protocol for the Preparation and Fluorescent ICC Staining of Non-adherent Cells
- Protocol for the Preparation and Fluorescent ICC Staining of Stem Cells on Coverslips
- Protocol for the Preparation of a Cell Smear for Non-adherent Cell ICC - Graphic
- R&D Systems Quality Control Western Blot Protocol
- TUNEL and Active Caspase-3 Detection by IHC/ICC Protocol
- The Importance of IHC/ICC Controls
- Troubleshooting Guide: Western Blot Figures
- Western Blot Conditions
- Western Blot Protocol
- Western Blot Protocol for Cell Lysates
- Western Blot Troubleshooting
- Western Blot Troubleshooting Guide
- View all Protocols, Troubleshooting, Illustrated assays and Webinars
Loading...
Associated Pathways
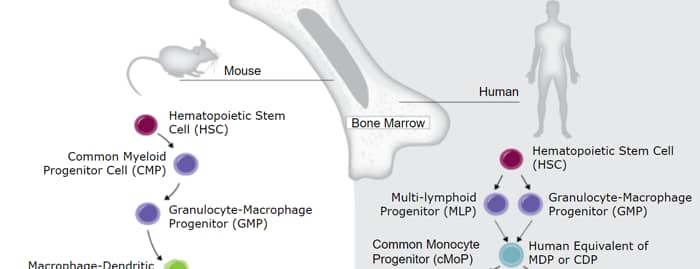


Innate Lymphoid Cell Differentiation Pathways
 NOD-like Receptor Signaling Pathways
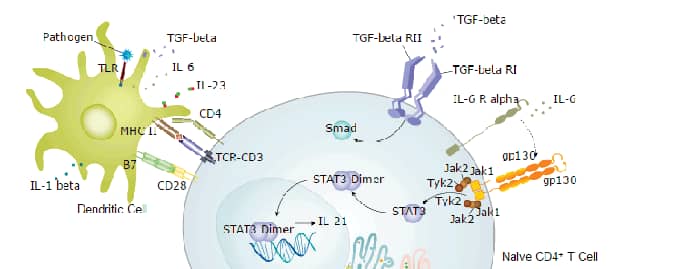
 Th17 Differentiation Pathway
 Toll-Like Receptor Signaling Pathways
