
Key Product Details
Validated by
Knockout/Knockdown, Biological Validation
Species Reactivity
Validated:
Human, Mouse, Rat
Cited:
Human, Mouse, Rat, Porcine, Avian - Chicken, Avian - Quail, Bovine, Canine, Chicken, Ferret, Fish, Fish - Danio rerio (Zebrafish), Frog - Xenopus (African Clawed Frog), Insect - Aedes albopictus (Asian tiger mosquito), Primate - Callithrix jacchus (Common Marmoset), Primate - Macaca fascicularis (Crab-eating Monkey or Cynomolgus Macaque), Primate - Macaca mulatta (Rhesus Macaque), Primate - Pan troglodytes (Chimpanzee), Rabbit, Transgenic Mouse, Xenograft, Xenopus, Zebrafish
Applications
Validated:
Immunohistochemistry, Western Blot, Immunocytochemistry, Simple Western, Chromatin Immunoprecipitation (ChIP)
Cited:
Immunohistochemistry, Immunohistochemistry-Paraffin, Immunohistochemistry-Frozen, Western Blot, Flow Cytometry, Immunofluorescence, Immunocytochemistry, Immunocytochemistry/ Immunofluorescence, Simple Western, Immunoprecipitation, Chromatin Immunoprecipitation (ChIP), Binding Assay, Bioassay, Co-Immunoprecipitation, Dot Blot, IF/ICC, Mass Spectrometry, RNAscope compatible
Label
Unconjugated
Antibody Source
Polyclonal Goat IgG
Loading...
Product Specifications
Immunogen
E. coli-derived recombinant human SOX2
Gly135-Met317
Accession # P48431
Gly135-Met317
Accession # P48431
Specificity
Detects human SOX2 in direct ELISAs and Western blots.
Clonality
Polyclonal
Host
Goat
Isotype
IgG
Scientific Data Images for SOX2 Antibody
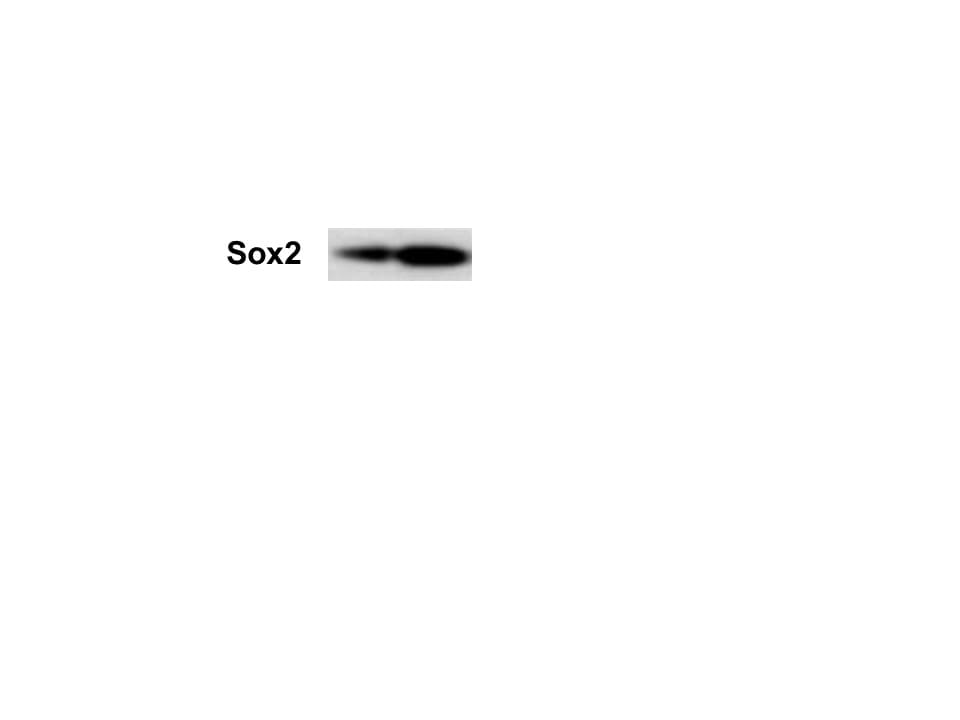
Detection of Human, Mouse, and Rat SOX2 by Western Blot.
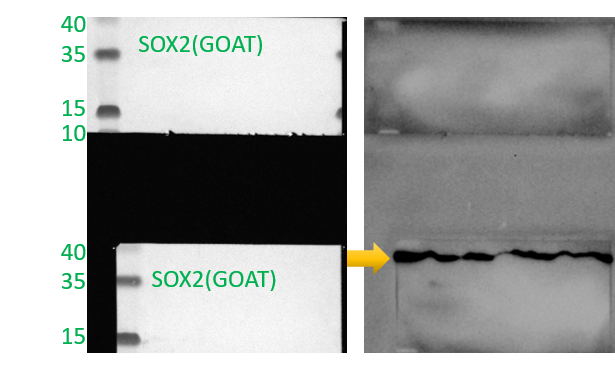
Western blot shows lysates of D3 mouse embryonic stem cell line, NTera-2 human testicular embryonic carcinoma cell line, F9 mouse teratocarcinoma stem cells, and rat cortical stem cells. PVDF membrane was probed with 1 µg/mL of Goat Anti-Human/Mouse/Rat SOX2 Antigen Affinity-purified Polyclonal Antibody (Catalog # AF2018) followed by HRP-conjugated Anti-Goat IgG Secondary Antibody (HAF017). A specific band was detected for SOX2 at approximately 36 kDa (as indicated). This experiment was conducted under reducing conditions and using Immunoblot Buffer Group 1.
Detection of SOX2-regulated Genes by Chromatin Immunoprecipitation.
BG01V human embryonic stem cells were fixed using formaldehyde, resuspended in lysis buffer, and sonicated to shear chromatin. SOX2/DNA complexes were immunoprecipitated using 5 µg Goat Anti-Human/Mouse/Rat SOX2 Antigen Affinity-purified Polyclonal Antibody (Catalog # AF2018) or control antibody (AB-108-C) for 15 minutes in an ultrasonic bath, followed by Biotinylated Anti-Goat IgG Secondary Antibody (BAF109). Immunocomplexes were captured using 50 µL of MagCellect Streptavidin Ferrofluid (MAG999) and DNA was purified using chelating resin solution. Thenanogpromoter was detected by standard PCR.
SOX2 in Mouse Cortical Stem Cells.
SOX2 was detected in immersion fixed undifferentiated mouse cortical stem cells using Goat Anti-Human/Mouse/Rat SOX2 Antigen Affinity-purified Polyclonal Antibody (Catalog # AF2018) at 10 µg/mL for 3 hours at room temperature. Cells were stained using the NorthernLights™ 557-conjugated Anti-Goat IgG Secondary Antibody (red; (NL001) and counterstained with DAPI (blue). Nestin was also detected in stem cells using Mouse Anti-Mouse/Rat Nestin Monoclonal Antibody (MAB2736) and co-stained using the NorthernLights™ 493-conjugated Anti-Mouse IgG Secondary Antibody (green; NL009). Specific staining of SOX2 was localized to nuclei. View our protocol for Fluorescent ICC Staining of Stem Cells on Coverslips.
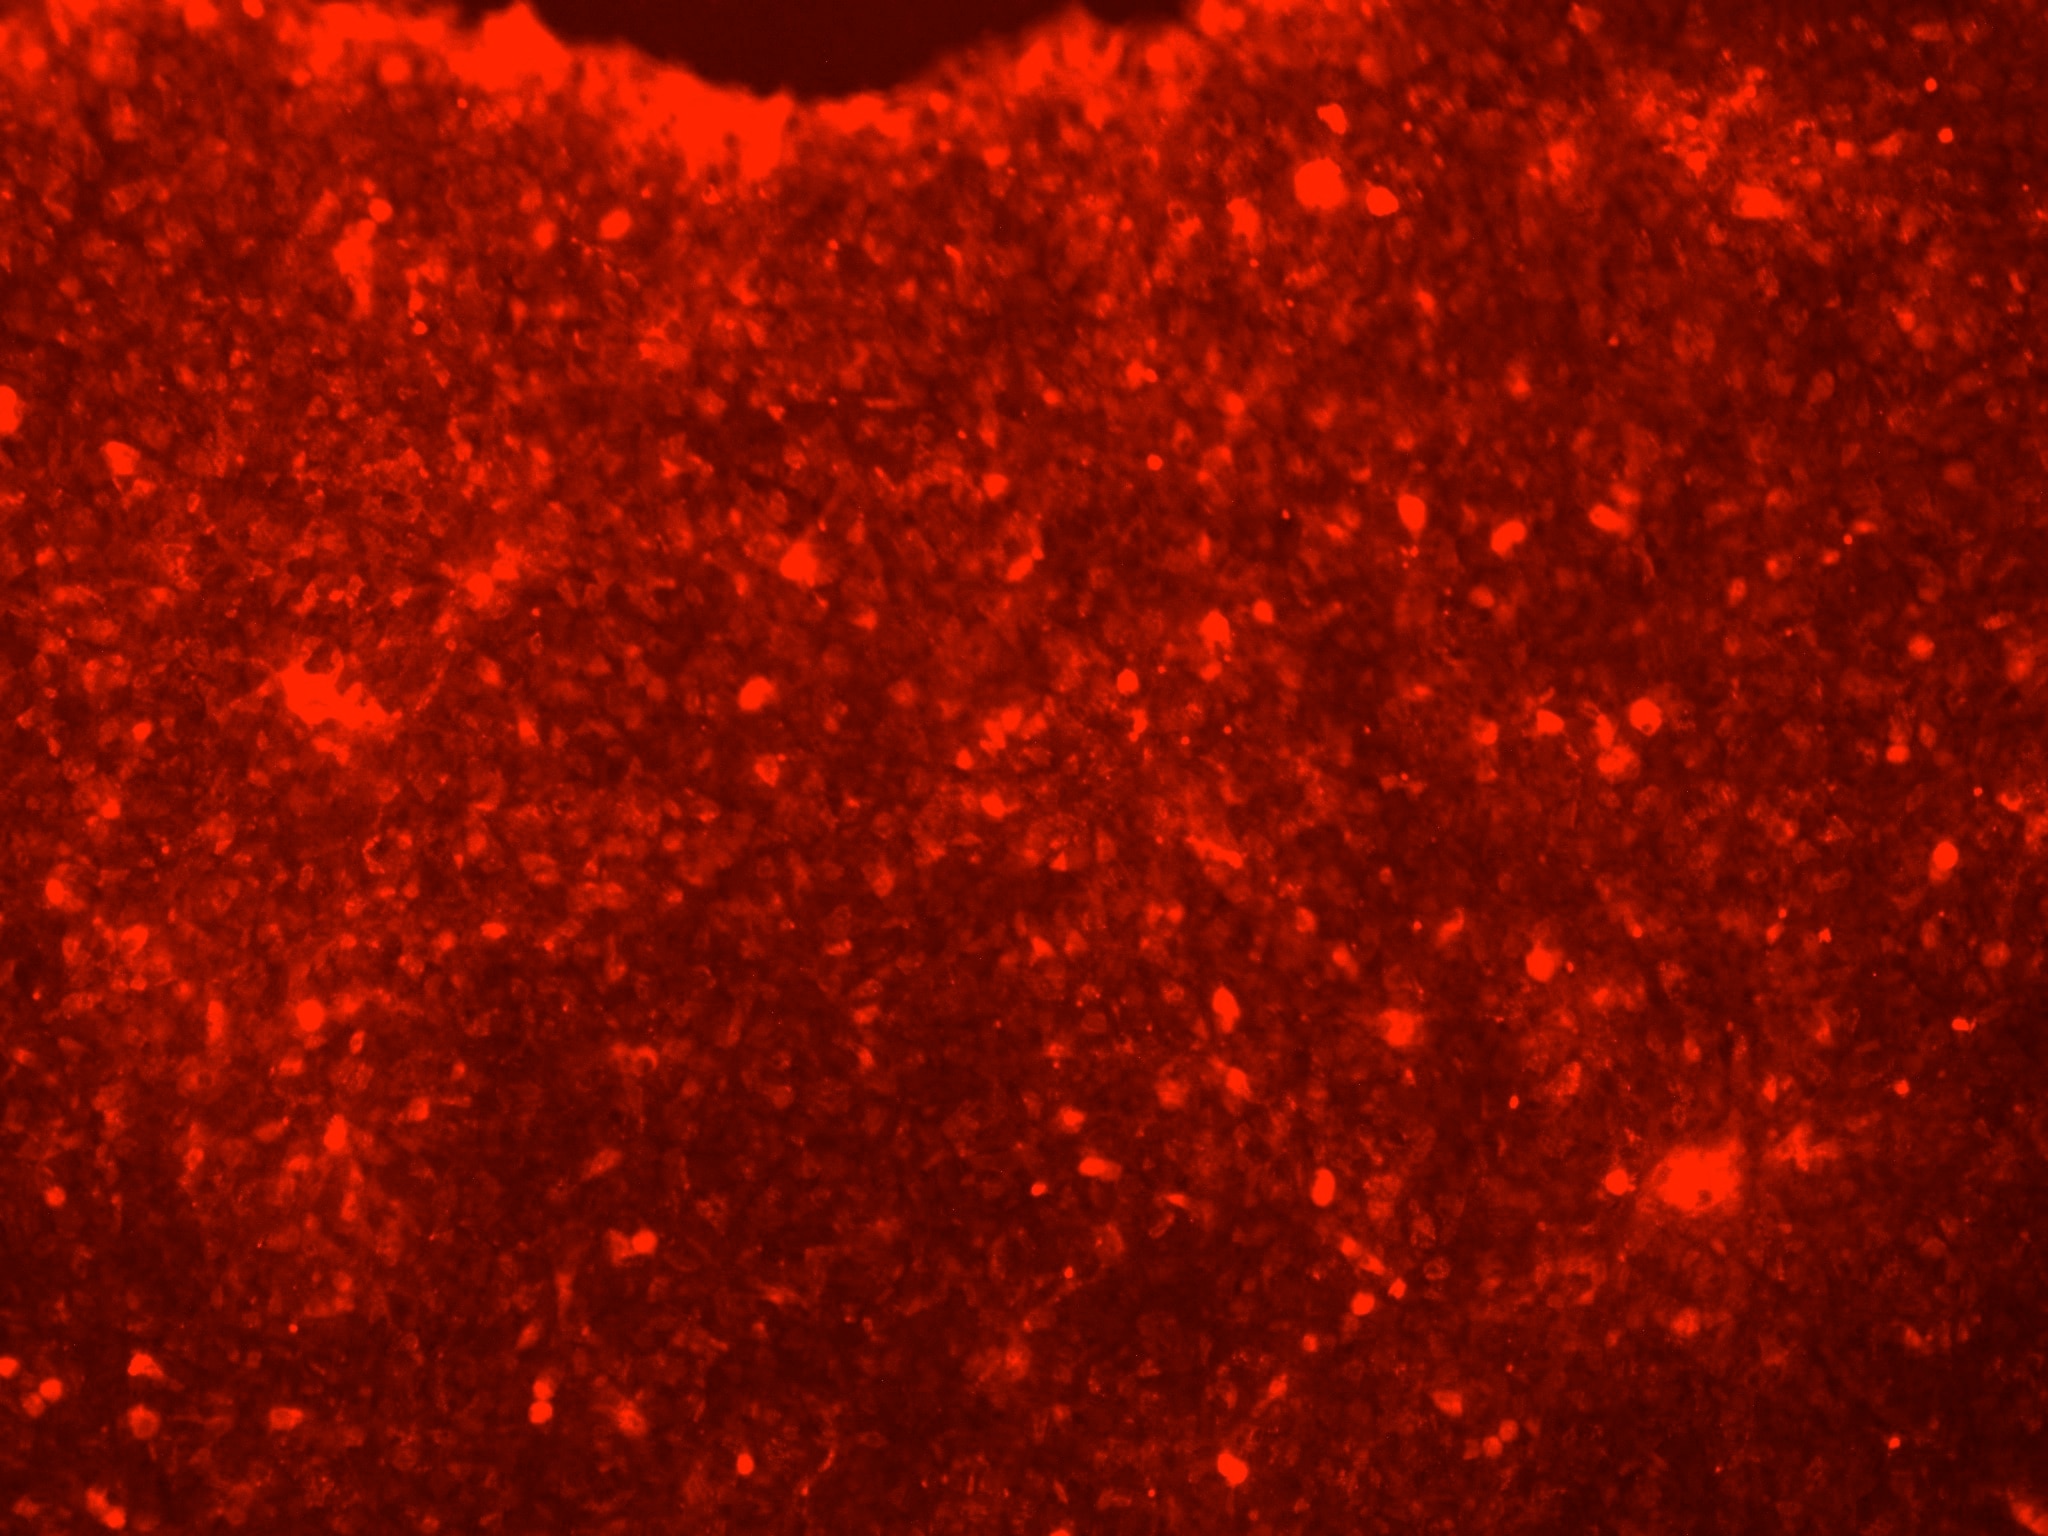
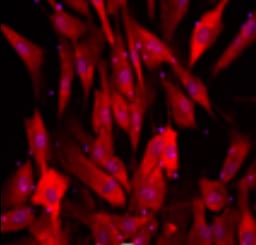
SOX2 in Rat Cortical Stem Cells.
SOX2 was detected in immersion fixed undifferentiated rat cortical stem cells using Goat Anti-Human/Mouse/Rat SOX2 Antigen Affinity-purified Polyclonal Antibody (Catalog # AF2018) at 10 µg/mL for 3 hours at room temperature. Cells were stained using the NorthernLights™ 557-conjugated Anti-Goat IgG Secondary Antibody (red; NL001) and counterstained with DAPI (blue). Nestin was also detected using Mouse Anti-Mouse/Rat Nestin Monoclonal Antibody (MAB2736) and stained using the NorthernLights™ 493-conjugated Anti-Mouse IgG Secondary Antibody (green; NL009). Specific staining of SOX2 was localized to nuclei. View our protocol for Fluorescent ICC Staining of Stem Cells on Coverslips.
Detection of Human SOX2 by Simple WesternTM.
Simple Western lane view shows lysates of BG01V human embryonic stem cells and NTera-2 human testicular embryonic carcinoma cell line, loaded at 0.2 mg/mL. A specific band was detected for SOX2 at approximately 53 kDa (as indicated) using 5 µg/mL of Goat Anti-Human/Mouse/Rat SOX2 Antigen Affinity-purified Polyclonal Antibody (Catalog # AF2018) followed by 1:50 dilution of HRP-conjugated Anti-Goat IgG Secondary Antibody (HAF109). This experiment was conducted under reducing conditions and using the 12-230 kDa separation system.
SOX2 in ADLF1 and FAB2 Stem Cell Lines.
SOX2 was detected in immersion fixed ADLF1 (top panel) and FAB2 (bottom panel) induced pluripotent stem cell lines using Goat Anti-Human/Mouse/Rat SOX2 Antigen Affinity-purified Polyclonal Antibody (Catalog # AF2018) at 10 µg/mL for 3 hours at room temperature. Cells were stained using the NorthernLights™ 557-conjugated Anti-Goat IgG Secondary Antibody (red; NL001) and counterstained with DAPI (blue). Specific staining was localized to nuclei. View our protocol for Fluorescent ICC Staining of Stem Cells on Coverslips.
Detection of SOX2 in glioblastoma.
SOX2 was detected in immersion fixed paraffin-embedded sections of glioblastoma using Goat Anti-Human/Mouse/Rat SOX2 Antigen Affinity-purified Polyclonal Antibody (Catalog # AF2018) at 3 µg/mL for 1 hour at room temperature followed by incubation with the Anti-Goat IgG VisUCyte™ HRP Polymer Antibody (Catalog # VC004). Before incubation with the primary antibody, tissue was subjected to heat-induced epitope retrieval using VisUCyte Antigen Retrieval Reagent-Basic (Catalog # VCTS021). Tissue was stained using DAB (brown) and counterstained with hematoxylin (blue). Specific staining was localized to nuclei in cancer cells. View our protocol for IHC Staining with VisUCyte HRP Polymer Detection Reagents. & HepG2 cells (Negative).")
Detection of SOX2 in NTera‑2 cells (Positive) & HepG2 cells (Negative).
SOX2 was detected in immersion fixed NTera‑2 human testicular embryonic carcinoma cells (Positive) & absent in HepG2 human hepatocellular carcinoma cells (Negative) using Goat Anti-Human/Mouse/Rat SOX2 Antigen Affinity-purified Polyclonal Antibody (Catalog # AF2018) at 5 µg/mL for 3 hours at room temperature. Cells were stained using the NorthernLights™ 557-conjugated Anti-Goat IgG Secondary Antibody (red; Catalog # NL001) and counterstained with DAPI (blue). Specific staining was localized to Cell surface and nuclear. View our protocol for Fluorescent ICC Staining of Cells on Coverslips.
Detection of Human SOX2 by Western Blot
Knockdown OGT inhibits proliferation and tumorsphere formation of hepatoma cell through reducing eIF4E expression. A, Huh7 and PLC/PRF/5 cells were infected with control shRNA, OGT shRNA2 alone, or with wild‐type eIF4E lentivirus. The cell lysates were harvested for western blotting analysis using indicated antibodies. beta ‐actin expression was served as a loading control. B, Cell proliferation of Huh7 and PLC/PRF/5 cells infected with lentiviruses as in panel (A) were measured with CCK8 assay. (C‐H) Huh7 and PLC/PRF/5 cells infected with lentiviruses as in panel (A) were seeded into 96‐well plates. After 12 d, tumorsphere were counted and quantified. Representative images of sphere (scale bars, 100 μm) were shown (C, F). The diameter of sphere (D, G) and number of sphere (E, H) were count. Data represent mean ± SD of at least three independent experiments. The two‐tailed Student's t tests were used. **P < 0.01. I, Huh7 cells expressing either OGT shRNA2 alone or with wild‐type eIF4E lentivirus were incubated with PE‐labelled anti‐AC133 antibody. The percentages of CD133+ cells in graphs were analysed by flow cytometry. Black line, control IgG staining; red line, CD133 staining. J, Cell lysates were examined by western blotting with indicated antibodies. The right panel showcases relative protein amounts of different groups. Error bars represent ±SD of triplicate experiments. **P < 0.01; n.s, no significance. K, Huh7 cells were collected and subjected to immunoprecipitation with antibody against eIF4E or normal mouse IgG. Total RNAs were purified from immunocomplexes and subjected to RT‐PCR to measure Sox2, OCT4, and KLF4 mRNAs associated with eIF4E Image collected and cropped by CiteAb from the following publication (https://pubmed.ncbi.nlm.nih.gov/30677218), licensed under a CC-BY license. Not internally tested by R&D Systems.
Detection of Human SOX2 by Immunohistochemistry
TP63 and SOX2 staining in cervical biopsies.Immunohistochemical staining of cervical biopsies. Bars = 50µm.(A) normal cervix no primary control; (B) normal cervix stained with anti-SOX2; (C) Squamous cell cervical carcinoma no primary control; (D) representative TP63, and (E) representative SOX2, staining of tumour cells. For both TP63 and SOX2 staining was seen in the nucleus of positive cells (examples indicated by solid arrows); negative cells were a minority of tumour cells (examples indicated by unfilled arrows). (F) Image analysis results of % nuclear +ve tumour cells in biopsies. Parallel sections from 11 cases were stained with SOX2 and TP63. Tumour cells were evaluated for their nuclear expression of the transcription factors. There was no significant difference between the data for SOX2 and TP63 (Wilcoxon signed rank test). Image collected and cropped by CiteAb from the following publication (https://pubmed.ncbi.nlm.nih.gov/25531390), licensed under a CC-BY license. Not internally tested by R&D Systems.
Detection of Zebrafish SOX2 by Immunohistochemistry
Direct effects of glucocorticoids in ependymal glia. (A–I) Zebrafish spinal cord transverse sections. (A–C) Immunostaining of wild-types for Nr3c1 (green) and Gfap (red), plus DAPI staining (blue) with Dex treatment at 24 h post sham injury (A), 24 h (B) and 48 h post SCI (C). Nuclear Nr3c1 (active) localization in Gfap-positive cells around the central canal is stimulated with Dex treatment. (D–F) Immunostaining for EGFP (pan-cytoplasmic) in the SR4G transgenic reporter line (green) and filamentous Gfap (red) at 24 h post sham injury (D) and SCI with no treatment (E) or 24 h post SCI +Dex (F). Nr3c1 signaling is constitutively active in ependymal glia in uninjured controls (D), diminished after SCI (E), and was maintained after SCI + Dex. (G–I) Immunostaining for Sox2 (green), PCNA (red) and Gfap (blue) from 48 h post sham injury (G), 48 h post SCI followed by no treatment (H), or 48 h post SCI +Dex (I). Sox2 immunoreactivity is reduced in ependymal glia and neural precursor cells after Dex treatment. Representative images from 10 spinal cords per time point in each condition. Scale bars, 20 μm (A is the same as B,C; D is the same as E,F; G is the same as H,I). ∗denotes central canal. Image collected and cropped by CiteAb from the following publication (https://pubmed.ncbi.nlm.nih.gov/31069223), licensed under a CC-BY license. Not internally tested by R&D Systems.
Detection of Mouse SOX2 by Chromatin Immunoprecipitation
Epigenetic perturbation of enhancer clustering and genome-widebinding.(A) The fluctuation range (x) and amplitude (y) were obtainedby fitting the pair-correlation function of the indicated dataset with thefluctuation model. Figure 2 and Figure 2—figure supplement 1,Equations10–13. Supplementary file 1. Data from the same conditionwere grouped in separate ellipses. (B) Sox2 ChIP-exo peakdensity distribution in the wild-type and TSA treated (red dotted) cellsacross chromosome 1, 2, 3. In the upper panels, each chromosome was dividedto 500 bins. The color map correlates with the number of peaks in each bin.Top 7000 binding sites were considered in each condition. (C)Cumulative density histogram of the distances to transcription start sites(TSS's) of Sox2 ChIP-exo peaks in WT, Sox2 ChIP-exo peaks in the TSA treatedcells (red dotted), and random genomic positions (gray).DOI:https://dx.doi.org/10.7554/eLife.04236.013 Image collected and cropped by CiteAb from the following publication (https://pubmed.ncbi.nlm.nih.gov/25537195), licensed under a CC-BY license. Not internally tested by R&D Systems.
Detection of Human SOX2 by Immunohistochemistry
TP63 and SOX2 staining in cervical biopsies.Immunohistochemical staining of cervical biopsies. Bars = 50µm.(A) normal cervix no primary control; (B) normal cervix stained with anti-SOX2; (C) Squamous cell cervical carcinoma no primary control; (D) representative TP63, and (E) representative SOX2, staining of tumour cells. For both TP63 and SOX2 staining was seen in the nucleus of positive cells (examples indicated by solid arrows); negative cells were a minority of tumour cells (examples indicated by unfilled arrows). (F) Image analysis results of % nuclear +ve tumour cells in biopsies. Parallel sections from 11 cases were stained with SOX2 and TP63. Tumour cells were evaluated for their nuclear expression of the transcription factors. There was no significant difference between the data for SOX2 and TP63 (Wilcoxon signed rank test). Image collected and cropped by CiteAb from the following publication (https://pubmed.ncbi.nlm.nih.gov/25531390), licensed under a CC-BY license. Not internally tested by R&D Systems.
Detection of Human SOX2 by Immunocytochemistry/Immunofluorescence
Generation of KCNA5 knockout model. (A) Illustration of polycistronic self-replicating RNA used for reprogramming (Yoshioka et al., 2013). Reading frames for OCT4, KLF4, SOX2, GLIS1, and puromycin resistance are separated by 2A peptide-encoding or IRES sequences. (B) Phase contrast morphology (5 x) and alkaline phosphatase staining of the F1 wild-type hiPSC line generated using the RNA vector shown in (A). (C) Representative F1 karyogram indicating a normal male genotype. (D) The RNA vector is undetectable in established F1 hiPSCs following puromycin withdrawal, whereas freshly transfected parental fibroblasts display robust transgene expression (RT-qPCR data, n = 2). (E) Bisulfite sequencing of OCT4 and NANOG promoter regions of the indicated samples showing an hESC-like hypomethylated state in F1 cells. (F) RT-qPCR analysis of F1 hiPSCs in comparison to the original fibroblasts and a hESC control (n = 2). (G) Immunostains showing robust pluripotency factor expression in F1 hiPSCs at the protein level. (H) Illustration of the Kv1.5 channel. The voltage sensor in transmembrane helix S4 is indicated by symbols. The ion pore region is in-between segments S5 and S6. (I)KCNA5 knockout strategy based on simultaneously transfecting 4 CRISPR/Cas9 nickase vectors targeting the 5' end of the 1-exon gene body. A mutant clone generated this way displayed homozygous deletions causing a frame shift and premature stop as illustrated at the bottom. (J) PCR spanning the mutation site validates the sequencing-verified frame shift-causing deletion in KCNA5fs/fs cells at the DNA and RNA levels. Image collected and cropped by CiteAb from the following publication (https://journal.frontiersin.org/article/10.3389/fphys.2017.00469/full), licensed under a CC-BY license. Not internally tested by R&D Systems.
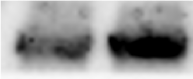
Detection of Human SOX2 by Western Blot
Construction and expression of srRNA.A: Scheme of Self-Replicating srRNA constructs. B: Expression of reprogramming factors in OKS-iM 4F-srRNA, OKS-iG 4F-srRNA, OKS-iGM 5F-srRNA, and OKS-iGML 6F-srRNA on day 2 (left) and day 10 (right). BJ cells were co-transfected with srRNAs plus B18R mRNA (1:1 srRNA:B18R mRNA), selected with puromycin and cultured in Advanced DMEM/10% FBS for 10 days. C: qRT-PCR analysis of LIN28A and NANOG from 4F-srRNA and 5F-srRNA transfected BJ cells normalized to GAPDH. Cells were selected with puromycin after the transfection, and cultured in Advanced DMEM/10% FBS (Ad) or ES medium. Cells were collected on day 2, 4, 6, 8 and 10 for 5F-srRNA, and day 10 for 4F-srRNA (OKS-iM and OKS-iG). D: Immunoblot analysis of LIN28A and NANOG in 5F-srRNA transfected BJ cells on day 6 and 10. iPSC: iPSC clone generated with 5F-srRNA from BJ cells. Image collected and cropped by CiteAb from the following publication (https://pubmed.ncbi.nlm.nih.gov/28750082), licensed under a CC-BY license. Not internally tested by R&D Systems.
Detection of Human Human/Mouse/Rat SOX2 Antibody by Immunocytochemistry/ Immunofluorescence
The Majority of Ferret and Human, but Not Mouse, Sox2-Positive Tbr2-Negative BPs Exhibit Nuclear YAP. (G and H) that are shown at higher magnification (F′, F″, G′, G″, H′, and H″), as indicated; selected Tbr2-positive nuclei that are YAP negative in mouse, ferret, and human are outlined by white lines.(I–K) Quantification of the percentage of Tbr2-negative nuclei in the VZ (I), Tbr2-positive nuclei in the VZ (J), and Tbr2-positive nuclei in the SVZ (K) that are YAP positive in mouse E14.5, ferret E36, and human 11 wpc neocortex. Two or three images per embryo-fetus were taken, 30 randomly picked Tbr2-negative nuclei in the VZ (I) and Tbr2-positive nuclei in the VZ (J) and SVZ (K) were scored per image, and the values obtained were averaged for each embryo-fetus. Data are the mean of three or four embryos-fetuses.(A–C and F–H) Images are 1-μm optical sections. Scale bars represent 50 μm (A–C and F–H), 10 μm (A′, B′, and C′), and 20 μm (F′, F″, G′, G″, H′, and H″).(D, E, and I–K) Error bars indicate SEM; ∗∗p < 0.01, ∗∗∗p < 0.001 (one-way ANOVA, post hoc Tukey HSD).See also Figures S1 and S2. Image collected and cropped by CiteAb from the following publication (https://pubmed.ncbi.nlm.nih.gov/31018127), licensed under a CC-BY license. Not internally tested by R&D Systems.
Detection of Human Human/Mouse/Rat SOX2 Antibody by Immunocytochemistry/ Immunofluorescence
The Majority of Ferret and Human, but Not Mouse, Sox2-Positive Tbr2-Negative BPs Exhibit Nuclear YAP(A–C) Double immunofluorescence for YAP (green) and Sox2 (magenta), combined with DAPI staining (white), of mouse E14.5 (A), ferret E36 (B), and human 14 wpc (C) neocortex. Boxes indicate areas in the SVZ (A) and oSVZ (B and C) that are shown at higher magnification (A′, B′, and C′); selected Sox2-positive nuclei that are YAP negative in mouse and YAP positive in ferret and human are outlined by white lines; arrowheads indicate a YAP-positive basal process of a bRG. Image collected and cropped by CiteAb from the following publication (https://pubmed.ncbi.nlm.nih.gov/31018127), licensed under a CC-BY license. Not internally tested by R&D Systems.
Detection of Mouse Human/Mouse/Rat SOX2 Antibody by Immunocytochemistry/ Immunofluorescence
The Majority of Ferret and Human, but Not Mouse, Sox2-Positive Tbr2-Negative BPs Exhibit Nuclear YAP.(F–H) Double immunofluorescence for YAP (green) and Tbr2 (magenta), combined with DAPI staining (white), of mouse E14.5 (F), ferret E36 (G), and human 11 wpc (H) neocortex. Boxes indicate areas in the VZ and SVZ (F) or iSVZ (G and H) that are shown at higher magnification (F′, F″, G′, G″, H′, and H″), as indicated; selected Tbr2-positive nuclei that are YAP negative in mouse, ferret, and human are outlined by white lines.(I–K) Quantification of the percentage of Tbr2-negative nuclei in the VZ (I), Tbr2-positive nuclei in the VZ (J), and Tbr2-positive nuclei in the SVZ (K) that are YAP positive in mouse E14.5, ferret E36, and human 11 wpc neocortex. Two or three images per embryo-fetus were taken, 30 randomly picked Tbr2-negative nuclei in the VZ (I) and Tbr2-positive nuclei in the VZ (J) and SVZ (K) were scored per image, and the values obtained were averaged for each embryo-fetus. Data are the mean of three or four embryos-fetuses.(A–C and F–H) Images are 1-μm optical sections. Scale bars represent 50 μm (A–C and F–H), 10 μm (A′, B′, and C′), and 20 μm (F′, F″, G′, G″, H′, and H″).(D, E, and I–K) Error bars indicate SEM; ∗∗p < 0.01, ∗∗∗p < 0.001 (one-way ANOVA, post hoc Tukey HSD).See also Figures S1 and S2. Image collected and cropped by CiteAb from the following publication (https://pubmed.ncbi.nlm.nih.gov/31018127), licensed under a CC-BY license. Not internally tested by R&D Systems.
Detection of Human Human/Mouse/Rat SOX2 Antibody by Immunocytochemistry/ Immunofluorescence
The Majority of Ferret and Human, but Not Mouse, Sox2-Positive Tbr2-Negative BPs Exhibit Nuclear YAP(A–C) Double immunofluorescence for YAP (green) and Sox2 (magenta), combined with DAPI staining (white), of mouse E14.5 (A), ferret E36 (B), and human 14 wpc (C) neocortex. Boxes indicate areas in the SVZ (A) and oSVZ (B and C) that are shown at higher magnification (A′, B′, and C′); selected Sox2-positive nuclei that are YAP negative in mouse and YAP positive in ferret and human are outlined by white lines; arrowheads indicate a YAP-positive basal process of a bRG.Image collected and cropped by CiteAb from the following publication (https://pubmed.ncbi.nlm.nih.gov/31018127), licensed under a CC-BY license. Not internally tested by R&D Systems.
Detection of Mouse SOX2 by Immunohistochemistry
Immunohistochemical analysis of Trp53-/-Notch1-/-Notch2-/- and Trp53-/-Rbpj-/- tumors. (A) A Trp53-/-Notch1-/-Notch2-/- tumor in the SVZ. Streams of tumor cells invading the brain parenchyma are indicated by arrowheads. The GFP expression from the Rosa-CAG::GFP Cre-reporter indicates derivation from Hes5+ cells. (B) Expression of GFP, progenitor (SOX2) and glial markers (OLIG2, GFAP), as well as staining for mitotically active cells (PCNA) and immature neurons (DCX) in Trp53-/-Notch1-/-Notch2-/- and Trp53-/-Rbpj-/- tumors. Image collected and cropped by CiteAb from the following open publication (https://pubmed.ncbi.nlm.nih.gov/36358826), licensed under a CC-BY license. Not internally tested by R&D Systems.
Detection of Mouse SOX2 by Immunocytochemistry/ Immunofluorescence
Deregulation of SOX2, ASCL1&OLIG2 TFs in p27KO cultures at the onset of differentiation. e Immunocytochemistry for p27 (red) in combination with ASCL1, OLIG2 or SOX2 (green) in 2 + 1DIV NPCs. Image collected & cropped by CiteAb from the following open publication (https://pubmed.ncbi.nlm.nih.gov/36627412), licensed under a CC-BY license. Not internally tested by R&D Systems.
Detection of Mouse SOX2 by Immunocytochemistry/ Immunofluorescence
Padi2/3 DKO TSCs exhibit diminished stem cell potential&are prone to differentiate into large trophoblast giant cells (TGCs). (D) Immunofluorescence staining on WT&Padi2/3 DKO TSCs for trophoblast stem cell markers CDX2&SOX2. Image collected & cropped by CiteAb from the following open publication (https://pubmed.ncbi.nlm.nih.gov/36010543), licensed under a CC-BY license. Not internally tested by R&D Systems.
Detection of Xenopus SOX2 by Immunohistochemistry Whole-Mount
Unedited images from samples featured in Figure 6.Stage 39–40 larvae were amputated and processed for whole-mount immunostaining at the indicated hour post amputation (hpa), with the exception of the 0 h group, which was first fixed and then amputated to represent the pre-amputation group. Images show representative total z-projections of whole-mount immunostained samples for each group corresponding to the edited images shown in Figure 6. Transverse red dashed line indicates amputation plane. Scale bar, 100 µm. Image collected and cropped by CiteAb from the following open publication (https://pubmed.ncbi.nlm.nih.gov/33955353), licensed under a CC-BY license. Not internally tested by R&D Systems.
Detection of Mouse SOX2 by Immunohistochemistry
Notch1 and Trp53 deletion in Hes5+ cells leads to formation of forebrain tumors in adult mice. (A) Kaplan–Meier curves showing survival of Hes5::CreERT2 Trp53-/-Notch1-/- and Trp53-/-Notch2-/- mutant mice. (B) A Trp53-/-Notch1-/- tumor in the forebrain. The GFP expression from the Rosa-CAG::GFP Cre-reporter indicates derivation from Hes5+ cells. (C) Percentages of Trp53-/-Notch1-/- and Trp53-/-Notch2-/- mice that developed hyperplasia or tumors in the brain. (D) A Trp53-/-Notch1-/- tumor (dashed line) in the anterior forebrain. In contrast, the forebrain of Trp53-/-Notch2-/- mice appears grossly normal. (E) Expression of GFP, progenitor (SOX2) and glial markers (OLIG2, GFAP), as well as staining for mitotically active cells (PCNA) and immature neurons (DCX) in Trp53-/-Notch1-/- tumors. Image collected and cropped by CiteAb from the following open publication (https://pubmed.ncbi.nlm.nih.gov/36358826), licensed under a CC-BY license. Not internally tested by R&D Systems.
Detection of Mouse SOX2 by Western Blot
Wnt signaling downregulates Tcf3 expression in mouse ESCs.A. qRT-PCR analysis of Tcf3 in wild type, ApcNN and ApcMin/Min ESCs. Actb was used as an internal control; bars represent n = 2 ± SD. B. Western blot analysis of the core pluripotency markers Oct4, Nanog, Sox2 and Tcf3 on protein lysates isolated from two independent ApcNN clones and wild type control ESCs. Actb and Tubulin were used as an internal control. C–D. qRT-PCR analysis of Tcf3 in wild type ESCs treated for different time intervals with Wnt3a conditioned medium (C), or with the GSK-inhibitor SB-216763 (D). L-medium and DMSO were employed as controls, respectively. Actb was used as an internal control; bars represent n = 2 ± SD. E. Time course western blot analysis of Tcf3 expression in wild type ESCs treated with Wnt3a conditioned medium (Wnt3a CM) or control L-medium (LM). Actb was used as an internal control. F. qRT-PCR analysis of Tcf3 and Wnt target genes Axin2 and Cdx1 in wild type ESC treated for 48 h with different concentrations of GSK-inhibitor SB-216763 or DMSO as control. Actb was used as an internal control; bars represent n = 2 ± SD. Image collected and cropped by CiteAb from the following open publication (https://pubmed.ncbi.nlm.nih.gov/23658527), licensed under a CC-BY license. Not internally tested by R&D Systems.
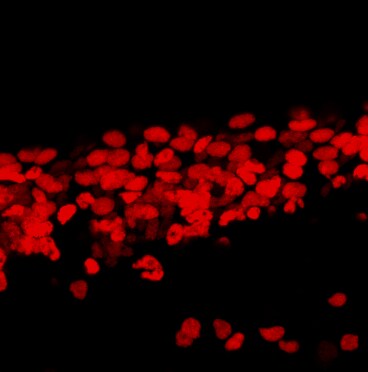
Detection of Human SOX2 by Immunohistochemistry
Fetal rat lung stained for Sox2 (red), co-stained with DAPI (blue). Image from a verified customer review.
Detection of SOX2 by Flow Cytometry
SOX2, OCT2, and PRRX1 are downstream effectors of the SETD2‐regulated EMT program. (A) Expression of SOX2, OCT2, and PRRX1 in TGF‐ beta ‐treated WT (72 h), SETD2 KO, and SETD2 rescue tested by RT‐qPCR (run in triplicate). (B) Migration capacity by wound healing assay, (C) invasiveness by transwell assay, and (D) stemness by 3D spheroid formation assay in RPTEC WT GFP (control vector), SETD2 KO1 and KO2, and SOX2/OCT2/PRRX1‐transduced WT RPTEC lines. Images are taken at 4× magnification, scale bar: 1000 μm for (B) and (D) and at 2.5× magnification, scale bar: 1200 μm for (C). Data are represented as mean ± SEM for triplicate reactions for B–D. P‐value is calculated by one‐way ANOVA in (A), (B), and (D). Two‐way ANOVA is used for statistical test for (C). ****P < 0.0001; ***P < 0.001; **P < 0.01; *P < 0.05; ns, P ≥ 0.05. (E) Model of the SETD2 loss‐driven EMT program through cell intrinsic (transcriptional) and cell extrinsic (paracrine) mechanisms. Image collected and cropped by CiteAb from the following open publication (https://pubmed.ncbi.nlm.nih.gov/37418588), licensed under a CC-BY license. Not internally tested by R&D Systems.
Detection of SOX2 by Flow Cytometry
Temporally coordinated expression of Sox2, Tbr2, NueroD, and Prox1 in gfap-GFP+ GNPs and differentiating granule neurons Gfap-GFP+/Sox2+ progenitor cells were found at the dentate neuroepithelium at E14 (arrow in A1). Sox2 expression was found at the VZ. Tbr2+ GNPs are then observed (red, arrow in A2). Tbr2 expression is followed by NeuroD expression (A3). Tbr2+/NeuroD+ GNPs are found (arrow, A3). The Tbr2+ GNPs (red) migrate toward the DG primordium and co-express Prox1 (green), a marker for early differentiating dentate granule neurons (arrow in A4). Gfap-GFP+ progenitors sequentially express Sox2, Tbr2, NeuroD1, and then, Prox1 in the developing DG at E16 (arrows in B1–B4, respectively). Some Sox2+/Tbr2+, Tbr2+/NeuroD+, and Tbr2+/Prox1+ GNPs are found. Similarly, gfap-GFP+ progenitor cells contribute to Tbr2+/NeuroD+ (arrows in D1,D2), Prox1+ GNPs (arrows in D3,D4) at P3. Schematic drawing of the expression patterns of gfap-GFP and transcription factors during the differentiation of GNPs (E). Scale bars; 200 μm in (A1–A4, B1–B4, C1–C3, D1,D3); 50 μm in (D2,D4). Image collected and cropped by CiteAb from the following open publication (https://www.frontiersin.org/articles/10.3389/fnins.2024.1425849/full), licensed under a CC-BY license. Not internally tested by R&D Systems.Applications for SOX2 Antibody
Application
Recommended Usage
Chromatin Immunoprecipitation (ChIP)
5 µg/5 x 106 cells
Sample: BG01V human embryonic stem cells chromatin, for detection see our available Human Nanog Primer Pair (Catalog # RDP-320-025)
Sample: BG01V human embryonic stem cells chromatin, for detection see our available Human Nanog Primer Pair (Catalog # RDP-320-025)
Immunocytochemistry
5-15 µg/mL
Sample: Immersion fixed NTera-2 human testicular embryonic carcinoma cell line, BG01V human embryonic stem cells cultured on irradiated mouse embryonic fibroblasts, undifferentiated mouse cortical stem cells, undifferentiated rat cortical stem cells, ADLF1 and FAB2 induced pluripotent stem cell lines, and HepG2 human hepatocellular carcinoma cells
Sample: Immersion fixed NTera-2 human testicular embryonic carcinoma cell line, BG01V human embryonic stem cells cultured on irradiated mouse embryonic fibroblasts, undifferentiated mouse cortical stem cells, undifferentiated rat cortical stem cells, ADLF1 and FAB2 induced pluripotent stem cell lines, and HepG2 human hepatocellular carcinoma cells
Immunohistochemistry
3-25 µg/mL
Sample: Immersion fixed paraffin-embedded sections of glioblastoma
Sample: Immersion fixed paraffin-embedded sections of glioblastoma
Simple Western
5 µg/mL
Sample: BG01V human embryonic stem cells and NTera‑2 human testicular embryonic carcinoma cell line
Sample: BG01V human embryonic stem cells and NTera‑2 human testicular embryonic carcinoma cell line
Western Blot
1 µg/mL
Sample: D3 mouse embryonic stem cell line, NTera‑2 human testicular embryonic carcinoma cell line, F9 mouse teratocarcinoma stem cells, and rat cortical stem cells
Sample: D3 mouse embryonic stem cell line, NTera‑2 human testicular embryonic carcinoma cell line, F9 mouse teratocarcinoma stem cells, and rat cortical stem cells
Reviewed Applications
Read 15 reviews rated 4 using AF2018 in the following applications:
- Chromatin Immunoprecipitation (1 Review)
- Immunocytochemistry/Immunofluorescence (3 Reviews)
- Immunofluorescence (1 Review)
- Immunohistochemistry (2 Reviews)
- Immunohistochemistry Free-Floating (1 Review)
- Immunohistochemistry-Frozen (3 Reviews)
- Immunohistochemistry-Paraffin (1 Review)
- Western Blot (3 Reviews)
Formulation, Preparation, and Storage
Purification
Antigen Affinity-purified
Reconstitution
Reconstitute at 0.2 mg/mL in sterile PBS. For liquid material, refer to CoA for concentration.
Loading...
Formulation
Lyophilized from a 0.2 μm filtered solution in PBS with Trehalose. *Small pack size (SP) is supplied either lyophilized or as a 0.2 µm filtered solution in PBS.
Shipping
Lyophilized product is shipped at ambient temperature. Liquid small pack size (-SP) is shipped with polar packs. Upon receipt, store immediately at the temperature recommended below.
Stability & Storage
Use a manual defrost freezer and avoid repeated freeze-thaw cycles.
- 12 months from date of receipt, -20 to -70 °C as supplied.
- 1 month, 2 to 8 °C under sterile conditions after reconstitution.
- 6 months, -20 to -70 °C under sterile conditions after reconstitution.
Calculators
Background: SOX2
References
- Graham, V. et al. (2003) Neuron 39:749.
- Avilion, A.A. et al. (2003) Genes Dev. 17:126.
- Kishi, M. et al. (2000) Development 127:791.
- Yuan, H. et al. (1995) Genes Dev. 9:2635.
- Uwanogho, D. et al. (1995) Mech. Dev. 49:23.
- Stevanovic, M. (2003) Mol. Biol. Rep. 30:127.
Long Name
Transcription Factor SOX2
Alternate Names
ANOP3, MCOPS3, MGC2413, SRY (sex determining region Y)-box 2, SRY-related HMG-box gene 2, transcription factor SOX2, transcription factor SOX-2
Entrez Gene IDs
6657 (Human)
Gene Symbol
SOX2
UniProt
Additional SOX2 Products
Product Documents for SOX2 Antibody
Certificate of Analysis
To download a Certificate of Analysis, please enter a lot or batch number in the search box below.
Note: Certificate of Analysis not available for kit components.
Product Specific Notices for SOX2 Antibody
For research use only
Citations for SOX2 Antibody
 Powered by Bioz
Customer Reviews for SOX2 Antibody (15)
4 out of 5
15 Customer Ratings
Have you used SOX2 Antibody?
Submit a review and receive an Amazon gift card!
$25/€18/£15/$25CAN/¥2500 Yen for a review with an image
$10/€7/£6/$10CAN/¥1110 Yen for a review without an image
Submit a review
Customer Images


Showing
1
-
5 of
15 reviews
Showing All
Filter By:
-
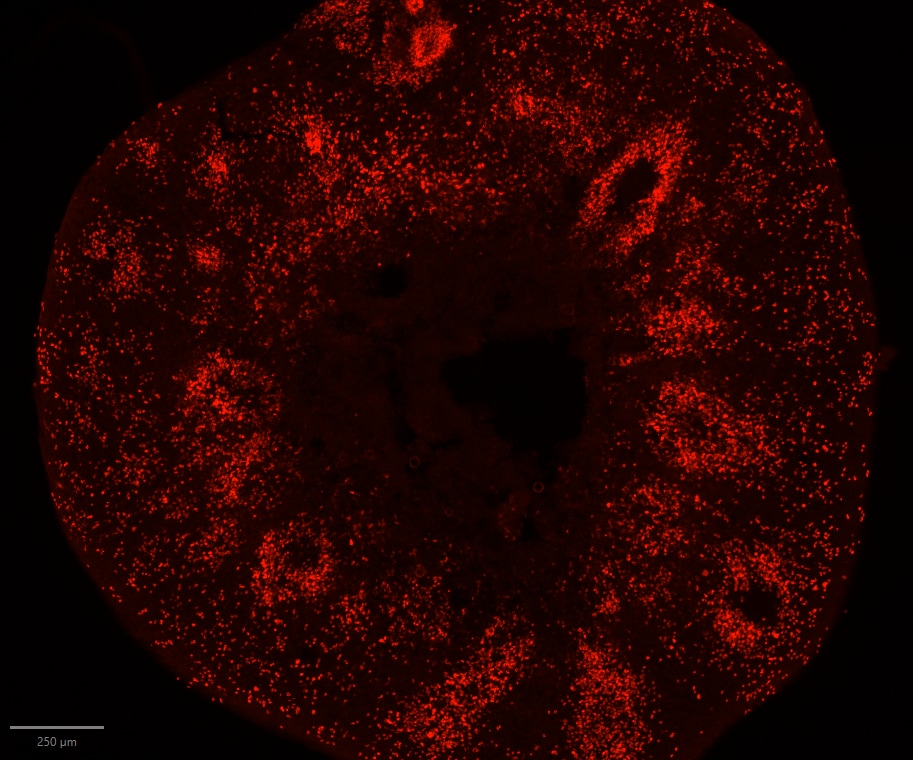
Application: Immunohistochemistry-FrozenSample Tested: striatal organoidSpecies: HumanVerified Customer | Posted 04/17/2026SOX2 staining in striatal organoid showing neural rosettesfixation: 4% PFA 4° overnight blocking + permeablization: 10% BSA + 1% TX in PBS Primary antibody: SOX2 (1:500) diluted in 4% BSA + 0.1% TX in PBS 4° overnight Secondary antibody: anti-goat 568 antibody diluted in 4% BSA + 0.1% TX RT 1h

-
Application: ImmunohistochemistrySample Tested: Lung tissueSpecies: RatVerified Customer | Posted 07/03/2025Fetal rat lung stained for Sox2 (red), co-stained with DAPI (blue)
-
Application: Western BlotVerified Customer | Posted 01/19/2024The goat antibody exhibits a strong background light intensity, with the concentration varying from 1:1000 to 1:3000, depending on the dilution of the secondary antibody.
-
Application: Western BlotSample Tested: Rat neuronsSpecies: RatVerified Customer | Posted 01/17/2022
-
Application: Immunocytochemistry/ImmunofluorescenceSample Tested: iPS2 human induced pluripotent stem cellsSpecies: HumanVerified Customer | Posted 10/09/2020Goat antibody used with Donkey anti goad linked to A647. We have another SOX2 antibody that works beautiful in the same conditions but it's not goat (we wanted a goat one). But the secondary antibody works with other goat antibodies too.
-
Application: Immunocytochemistry/ImmunofluorescenceSample Tested: iPS cellsSpecies: HumanVerified Customer | Posted 07/31/2020staining of cortical spheroids derived from iPS cells
-
Application: Immunohistochemistry Free-FloatingSample Tested: Adult brainSpecies: MouseVerified Customer | Posted 04/28/2020Sox2 staining of stem cells in the adult brain (AF594)The samples were PFA fixed. Further treatment was in Methanol. Blocking and Staining was done with 10%NDS in PBST for primary (Overnight at 4 degrees) and secondary (RT-2hrs)
-
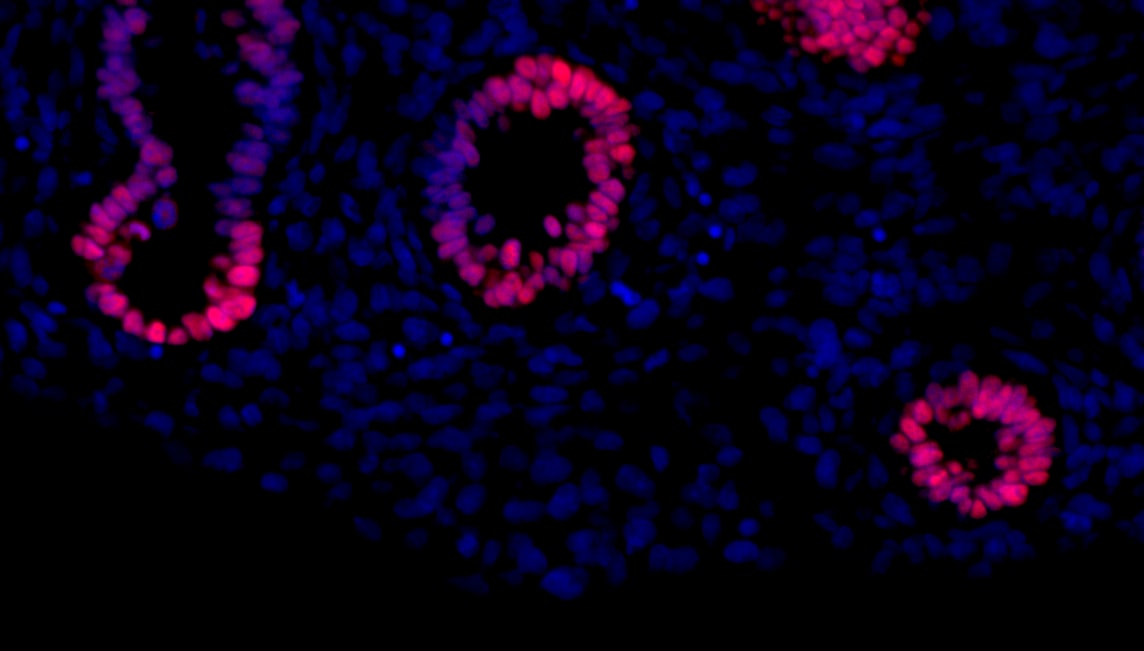
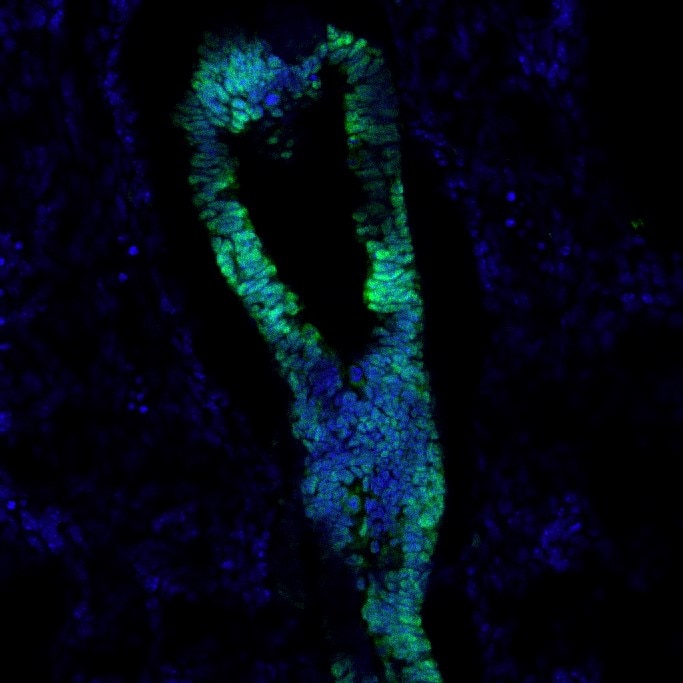
Application: Immunocytochemistry/ImmunofluorescenceSample Tested: Embryonic lungSpecies: MouseVerified Customer | Posted 10/09/2019The sample (mouse embryonic lung) was fixed in 4% PFA for 1 hour and washed 3 times with PBS prior to embedding in OCT and cryosection. No antigen retrieval required. It labels the epithelial cells of bronchioles. Works Great!
-
Application: Immunohistochemistry-FrozenSample Tested: Optic nerveSpecies: FelineVerified Customer | Posted 07/15/2019Image was acquired using fluorescence microscopy - immunolabeling with AF2018 antibody (magenta) and DAPI (blue) are shown.
-
Application: Western BlotSample Tested: IPS2 induced pluripotent stem cellsSpecies: MouseVerified Customer | Posted 01/25/2018
-
Application: ImmunohistochemistrySample Tested: Embryonic stem cells differentiated into dopaminergic neuronsSpecies: HumanVerified Customer | Posted 11/23/2017
-
Application: Immunohistochemistry-ParaffinSample Tested: See PMID 22489004Species: HumanVerified Customer | Posted 01/06/2015
-
Application: Immunohistochemistry-FrozenSample Tested: See PMID 23228673Species: MouseVerified Customer | Posted 01/06/2015
-
Application: ImmunofluorescenceSample Tested: See PMID19923274Species: OtherVerified Customer | Posted 01/06/2015
-
Application: Chromatin ImmunoprecipitationSample Tested: See PMID 23159369Species: HumanVerified Customer | Posted 01/06/2015
There are no reviews that match your criteria.
Protocols
Find general support by application which include: protocols, troubleshooting, illustrated assays, videos and webinars.
- Antigen Retrieval Protocol (PIER)
- Antigen Retrieval for Frozen Sections Protocol
- Appropriate Fixation of IHC/ICC Samples
- Cellular Response to Hypoxia Protocols
- ChIP Protocol Video
- Chromatin Immunoprecipitation (ChIP) Protocol
- Chromatin Immunoprecipitation Protocol
- Chromogenic IHC Staining of Formalin-Fixed Paraffin-Embedded (FFPE) Tissue Protocol
- Chromogenic Immunohistochemistry Staining of Frozen Tissue
- ClariTSA™ Fluorophore Kits
- Detection & Visualization of Antibody Binding
- Fluorescent IHC Staining of Frozen Tissue Protocol
- Graphic Protocol for Heat-induced Epitope Retrieval
- Graphic Protocol for the Preparation and Fluorescent IHC Staining of Frozen Tissue Sections
- Graphic Protocol for the Preparation and Fluorescent IHC Staining of Paraffin-embedded Tissue Sections
- Graphic Protocol for the Preparation of Gelatin-coated Slides for Histological Tissue Sections
- ICC Cell Smear Protocol for Suspension Cells
- ICC Immunocytochemistry Protocol Videos
- ICC for Adherent Cells
- IHC Sample Preparation (Frozen sections vs Paraffin)
- Immunocytochemistry (ICC) Protocol
- Immunocytochemistry Troubleshooting
- Immunofluorescence of Organoids Embedded in Cultrex Basement Membrane Extract
- Immunofluorescent IHC Staining of Formalin-Fixed Paraffin-Embedded (FFPE) Tissue Protocol
- Immunohistochemistry (IHC) and Immunocytochemistry (ICC) Protocols
- Immunohistochemistry Frozen Troubleshooting
- Immunohistochemistry Paraffin Troubleshooting
- Preparing Samples for IHC/ICC Experiments
- Preventing Non-Specific Staining (Non-Specific Binding)
- Primary Antibody Selection & Optimization
- Protocol for Heat-Induced Epitope Retrieval (HIER)
- Protocol for Making a 4% Formaldehyde Solution in PBS
- Protocol for VisUCyte™ HRP Polymer Detection Reagent
- Protocol for the Fluorescent ICC Staining of Cell Smears - Graphic
- Protocol for the Fluorescent ICC Staining of Cultured Cells on Coverslips - Graphic
- Protocol for the Preparation & Fixation of Cells on Coverslips
- Protocol for the Preparation and Chromogenic IHC Staining of Frozen Tissue Sections
- Protocol for the Preparation and Chromogenic IHC Staining of Frozen Tissue Sections - Graphic
- Protocol for the Preparation and Chromogenic IHC Staining of Paraffin-embedded Tissue Sections
- Protocol for the Preparation and Chromogenic IHC Staining of Paraffin-embedded Tissue Sections - Graphic
- Protocol for the Preparation and Fluorescent ICC Staining of Cells on Coverslips
- Protocol for the Preparation and Fluorescent ICC Staining of Non-adherent Cells
- Protocol for the Preparation and Fluorescent ICC Staining of Stem Cells on Coverslips
- Protocol for the Preparation and Fluorescent IHC Staining of Frozen Tissue Sections
- Protocol for the Preparation and Fluorescent IHC Staining of Paraffin-embedded Tissue Sections
- Protocol for the Preparation of Gelatin-coated Slides for Histological Tissue Sections
- Protocol for the Preparation of a Cell Smear for Non-adherent Cell ICC - Graphic
- R&D Systems Quality Control Western Blot Protocol
- TUNEL and Active Caspase-3 Detection by IHC/ICC Protocol
- The Importance of IHC/ICC Controls
- Troubleshooting Guide: Immunohistochemistry
- Troubleshooting Guide: Western Blot Figures
- Western Blot Conditions
- Western Blot Protocol
- Western Blot Protocol for Cell Lysates
- Western Blot Troubleshooting
- Western Blot Troubleshooting Guide
- View all Protocols, Troubleshooting, Illustrated assays and Webinars

