Hypoxia Detection Methods
Hypoxia Markers | Hypoxia Detection in Cell Lysate | Hypoxia Detection in Single Cells | Hypoxia in Culture Models
How is Hypoxia Detected?
While specialized machinery can directly control and measure levels of oxygen, methods to monitor hypoxia often rely on strategies for the detection of HIF protein expression and other hypoxia markers. Monitoring HIF-alpha levels within cells and tissues provides a measure of the extent of hypoxia and hypoxic gradients. Because HIFs have a notoriously short half-life and are extremely sensitive to oxygen levels, hypoxia is also monitored by key proteins regulated by HIFs (e.g., CA IX, VEGF). Other strategies to detect and monitor hypoxia in vitro include monitoring changes in gene expression via in situ hybridization (ISH) or using fluorescent oxygen-sensitive dyes. Pimonidazole (Catalog # 6182) is commonly used to detect hypoxia in vivo.
Hypoxia Markers
Common Hypoxia Marker Antibodies
| Target | Signaling |
|---|---|
| HIF-1 alpha | Learn more about Hypoxia Inducible Factors (HIFs) |
| HIF-2 alpha/EPAS1 | |
| Carbonic Anhydrase IX (CA9) | Cellular Metabolism |
| GLUT1 | |
| PDK1 | |
| VEGF | Angiogenesis |
| BNIP3 | Cell Death |
Under normoxic conditions, HIF-alpha subunits are rapidly targeted for degradation by the proteasomal system. Under hypoxia, HIF-alpha subunits are stable resulting in increased protein levels, particularly in the nucleus. Stabilization of HIF-alpha leads to increased expression of downstream proteins, adapting the cells to their hypoxic environment.
Find our top cited HIF-1 alpha antibody (NB100-105), with over 900 citations.
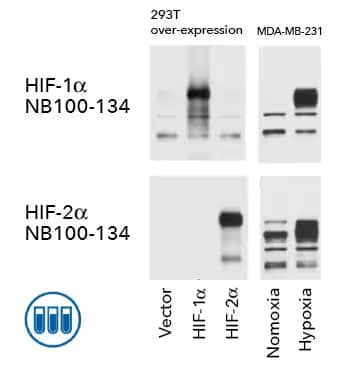
Biological Strategies. Western Blot: Specificity of HIF-2 alpha antibody in MDA-MB-231 cell lysate (overexpression and endogenous samples) using Rabbit Anti-HIF-2 alpha/EPAS1 Polyclonal Antibody (Catalog # NB100-122). The data shows that HIF-2 alpha antibody does not cross-react with HIF-1 alpha overexpression. Additionally, elevated levels of HIF-1 and HIF-2 alpha were detected following incubation of MDA-MB-231 cells under hypoxic conditions. This specificity of this antibody has also been validated with Genetic and Orthogonal Strategies.
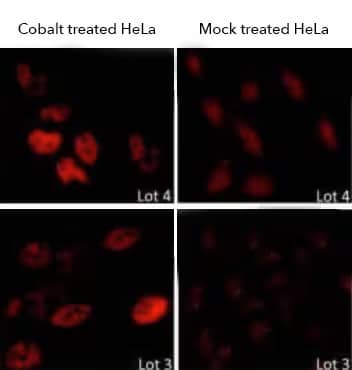
Biological Strategies. Immunocytochemistry/Immunofluorescence (ICC/IF): Comparison of HIF-1 alpha expression in Cobalt Chloride (CoCl2) treated (left) and untreated (right)HeLa cells using Rabbit Anti-HIF-1 Alpha Polyclonal Antibody (Catalog # NB100-449). The specificity of this antibody has also been validated with Genetic Strategies.
Carbonic anhydrase IX (CA IX) is a transmembrane glycoprotein induced under hypoxic conditions. Induction of CA IX expression is regulated by HIFs via interaction with an HIF-responsive element (HRE) sequence within the 5’ promoter region of CA IX gene. Because CA IX catalyzes the metabolism of CO2 to carbonic acid, its induction under hypoxic conditions is associated with tumor acidification and poor prognosis in tumors like clear cell renal carcinoma.
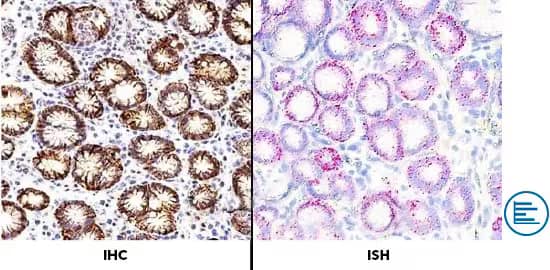
Orthogonal Strategies Validation. Dual RNAscope ISH-IHC: Formalin-fixed paraffin-embedded tissue sections of human stomach were probed for Carbonic Anhydrase IX/CA9 mRNA (RNAScope Probe, catalog # 559348; Fast Red chromogen, catalog # 322750). Adjacent tissue section was processed for immunohistochemistry using Rabbit Anti-Carbonic Anhydrase IX/CA9 (Catalog # NB100-417) at 1:1000 dilution with overnight incubation at 4° Celsius followed by incubation with anti-rabbit IgG VisUCyte HRP Polymer Antibody (Catalog # VC003) and DAB chromogen (yellow-brown). Tissue was counterstained with hematoxylin (blue). This antibody has been validated with Genetic and Biological Strategies.
Vascular endothelial growth factor (VEGF) is a key regulator of angiogenesis, the process by which new vessels are formed from pre-existent vasculature. VEGF and its receptors VEGF-R1, VEGF-R2 and VEGF-R3 are induced under hypoxia and play critical roles in the formation of new tumor vasculature. Monitoring VEGF/VEGF-R expression serves as a marker for hypoxia.
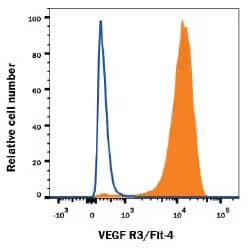
Flow Cytometry. Mouse endothelioma cell line bEnd.3 was stained with Goat Anti-Mouse VEGFR3/Flt 4 Polyclonal Antibody (Catalog # AF743, filled histogram) or Goat IgG Isotype Control Antibody (Catalog # AB-108-C, open histogram), followed by PE-conjugated Donkey Anti-Goat IgG Secondary Antibody (Catalog # F0107).
In addition to observed changes in protein expression, hypoxia and the cellular stress response can be monitored by interrogating the function of mitochondria. Mitochondria are an important site of oxygen consumption within the cell, converting glucose into ATP via oxidative phosphorylation (OXPHOS). In addition to the cellular response to hypoxia, mitochondria are critically important in the cellular stress response pathways of autophagy and apoptosis. Bio-Techne has antibodies to critical mitochondrial markers, including ATP5A, NDUFC2 and COX4.
Mitochondrial function can also be assessed with various fluorescent probes available through Bio-Techne brand, Tocris.
| Fluorescent Dye | Excitation/Emission (nm) | Function |
|---|---|---|
| Mito-HE | 510/580 | Fluorescent mitochondrial superoxide indicator in live cells. |
| Peroxy Orange 1 | 543/545 to 750 | Cell-permeable fluorescent probe for imaging hydrogen peroxide (H2O2). |
| H2DCFDA | 490/520 | Fluorescent indicator of reactive oxygen species (ROS). Only fluorescent after oxidation. |
Hypoxia Marker Detection in Cell Lysate
Detection and monitoring of hypoxia in cell lysate are important tools to understand the nature of the cellular environment on a population level. Techniques to detect and monitor hypoxia markers in cell lysate include western blot and ELISA.
| Application | Advantages | Limitations | Bio-Techne Product Offering |
|---|---|---|---|
| Western Blot |
|
| |
| Immunoassay (ELISA, Luminex) |
|
|
Bio-Techne offers instruments to automate and streamline western blot and ELISA workflows:
Automate Your Western Blot with Simple Western
Do more with your western blots with Simple Western from ProteinSimple, a Bio-Techne Brand. Find antibodies validated for Simple Western.

Ella: Your Next Generation ELISA
• 90 - Minute Assay
• No manual steps
• Sub-picogram sensitivity and 4-log dynamic range.
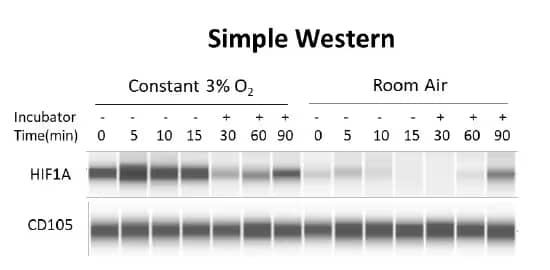
Simple Western. Mesenchymal stem cells (MSCs) media was changed in either a constant 3% O2 environment (left) or in room air (right) and levels of HIF1A were analyzed by simple western. Lysates were probed with Rabbit anti-HIF1A Monoclonal Antibody (2443C) (Catalog # NBP2-75978) and Goat Anti-Endoglin/CD105 Polyclonal Antibody (Catalog # AF1097). Data shows HIF1A protein expression changing substantially in room air environment compared to low oxygen environment, while CD105 a marker to delineate MSCs, remains constant. The specificity of NBP2-75978 and AF1097 have been validated by Genetic Strategies. NBP2-75978 specificity has also been validated by Biological Strategies.
While useful for preliminary screening, these whole cell lysate or subcellular fraction analyses present an average of total protein expression in the sample. Cells are exposed to various degrees of hypoxia depending on their location within the microenvironment and differential cellular responses would only be visible by a more nuanced, single-cell approach.
Single-Cell Detection of Hypoxia
Detection of hypoxia at the single-cell level can provide important information about the individual cellular response to hypoxia and how cells respond to the hypoxic gradient within cultures and tissues. In general, these techniques allow for more phenotypic information from one sample and show heterogeneity within cell cultures and tissue samples. Some common techniques to analyze hypoxia at single-cell level include flow cytometry, mass cytometry, ICC, IHC, ISH, and imaging cytometry.
| Application | Advantages | Limitations | Bio-Techne Product Offering |
|---|---|---|---|
| Flow Cytometry and Mass Cytometry (CyTOF) |
|
| |
| IHC/ICC |
|
| Hypoxia Marker Antibodies for IHC |
| ISH |
|
| RNAscope probes and RNAscope detection kits from Antibodies validated for Dual RNAscope ISH-IHC |
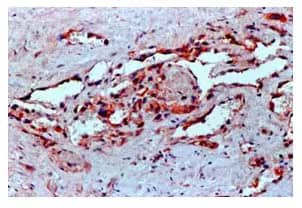
Immunohistochemistry (IHC)-Paraffin: IHC analysis of a formalin-fixed paraffin embedded human angiosarcoma tissue section using Mouse Anti-VEGF Monoclonal Antibody (VG1) (Catalog # NB100-664). The endothelial cells of the blood vessels and most of the cancer cells showed strong positivity for VEGF protein. The specificity of this antibody has been validated with Biological Strategies.
Additional techniques include imaging cytometry and imaging mass cytometry, combining the single-cell resolution and high throughput nature of conventional cytometry with the spatial data acquired with imaging techniques.
Hypoxia in 2D and 3D Culture Models
Hypoxia is common in tumors and occurs as the result of increased cell proliferation and metabolism, as well as deficiencies in blood supply and reduced tissue-oxygen diffusion. These factors continually expose tumor cells to fluctuating oxygenation which is difficult to replicate in the laboratory setting.
Hypoxia is common in tumors and occurs as the result of increased cell proliferation and metabolism, as well as deficiencies in blood supply and reduced tissue-oxygen diffusion. These factors continually expose tumor cells to fluctuating oxygenation which is difficult to replicate in the laboratory setting.
2D cell culture model systems have been predominantly used to study hypoxic responses. Most studies rely on culturing homogeneous cancer cell lines on flat surfaces that do not replicate the biologically significant extracellular environment.
Additional limitations of monolayer cell cultures include:
- Cell-cell interactions are unlike those found in vivo
- Cells acquire abnormal morphology
- Cells have atypical distribution of membrane proteins
Various studies have shown that signaling pathways activated and resulting cellular adaptations that occur under hypoxia are influenced by the way cells are cultured in vitro. Therefore, 3D spheroid cell cultures have progressively become more accepted as model systems that more faithfully replicate the tumor microenvironment.
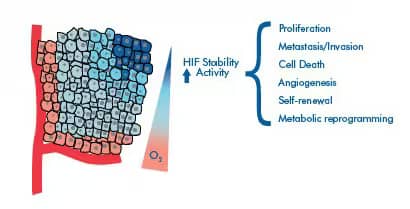
HIFs are stabilized in spheroids according to graded oxygen levels, similar to hypoxic tumor regions, reaching maximal expression in cells peripheral to the core. Several types of 3D spherical cultures have been developed that are reviewed in the white paper, A Technical Perspective: Understanding the Cellular Response to Hypoxia through In Vitro Model Systems