Best Seller
Neuron-specific beta-III Tubulin Antibody (TuJ-1)
R&D Systems | Catalog # MAB1195

Key Product Details
Species Reactivity
Validated:
Multi-Species
Cited:
Human, Mouse, Rat, Porcine, Amphibian, Amphibian - Ambystoma mexicanum (Axolotl), Amphibian - Axolotl, Amphibian - Salamander, Avian, Avian - Chicken, Avian - Quail, Chicken, Primate - Macaca mulatta (Rhesus Macaque), Primate - Papio anubis (Olive Baboon), Transgenic Mouse, Transgenic Rat, Xenograft
Applications
Validated:
Immunohistochemistry, Western Blot, Intracellular Staining by Flow Cytometry, Immunocytochemistry, Simple Western
Cited:
Immunohistochemistry, Immunohistochemistry-Paraffin, Immunohistochemistry-Frozen, Western Blot, Neutralization, Flow Cytometry, Immunofluorescence, Immunocytochemistry, Immunocytochemistry/ Immunofluorescence, Simple Western, Immunoprecipitation, HSI Microscopy, IF/ICC
Label
Unconjugated
Antibody Source
Monoclonal Mouse IgG2A Clone # TuJ-1
Loading...
Product Specifications
Immunogen
Rat brain-derived microtubules
Specificity
Detects mammalian and chicken neuron-specific beta -III tubulin but not other beta -tubulin isotypes in Western blots.
Clonality
Monoclonal
Host
Mouse
Isotype
IgG2A
Scientific Data Images for Neuron-specific beta-III Tubulin Antibody (TuJ-1)
Detection of beta ‑III Tubulin in A172 cells by Flow Cytometry
A172 cells were stained with Mouse Anti-Neuron-specific beta ‑III Tubulin Monoclonal Antibody (Catalog # MAB1195, filled histogram) or isotype control antibody (Catalog # MAB003, open histogram) followed by Allophycocyanin-conjugated Anti-Mouse IgG Secondary Antibody (Catalog # F0101B). To facilitate intracellular staining, cells were fixed with Flow Cytometry Fixation Buffer (Catalog # FC004) and permeabilized with Saponin. View our protocol for Staining Intracellular Molecules.
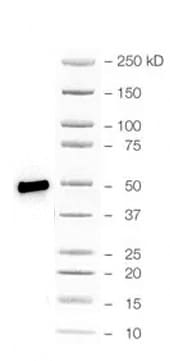
Detection of Human and Mouse beta ‑III Tubulin by Western Blot.
Western blot shows lysates of human brain (cerebellum) tissue, human brain (hypothalamus) tissue, mouse brain (cerebellum) tissue, and mouse brain (stem) tissue. PVDF membrane was probed with 0.2 µg/mL of Mouse Anti-Neuron-specific beta -III Tubulin Monoclonal Antibody (Catalog # MAB1195) followed by HRP-conjugated Anti-Mouse IgG Secondary Antibody (HAF018). A specific band was detected for beta -III Tubulin at approximately 55 kDa (as indicated). This experiment was conducted under reducing conditions and using Immunoblot Buffer Group 1.
beta ‑III Tubulin in Rat Cortical Neurons and GFAP in Rat Astrocytes.
beta -III Tubulin was detected in rat cortical neurons using 5 µg/mL neuron-specific Mouse Anti-Neuron-specific beta -III Tubulin Monoclonal Antibody (Catalog # MAB1195). GFAP was detected in rat astrocytes using 10 µg/mL Human GFAP Antigen Affinity-purified Polyclonal Antibody (AF2594). Cells were incubated with primary antibodies for 3 hours at room temperature. Cells were stained for beta-III Tubulin using the NorthernLights™ 557-conjugated Anti-Mouse IgG Secondary Antibody (red; NL007) and for GFAP using the NorthernLights 493-conjugated Anti-Sheep IgG Secondary Antibody (green; NL012). View our protocol for Fluorescent ICC Staining of Cells on Coverslips.
beta ‑III Tubulin in Differentiated Human Neural Progenitor Cells.
beta ‑III Tubulin was detected in immersion fixed differentiated human neural progenitor cells using Mouse Anti-Neuron-specific beta ‑III Tubulin Monoclonal Antibody (clone TuJ-1) (Catalog # MAB1195) for 3 hours at room temperature. Cells were stained (green) and counterstained (red). View our protocol for Fluorescent ICC Staining of Cells on Coverslips.
beta ‑III Tubulin and Nestin in Rat Cortical Stem Cells.
beta -III Tubulin and Nestin were detected in rat cortical stem cells (Catalog # NSC001) using 5 µg/mL neuron-specific Mouse Anti-Neuron-specific beta -III Tubulin Monoclonal Antibody (Catalog # MAB1195) and 10 µg/mL Rat Nestin Antigen Affinity-purified Polyclonal Antibody (AF2736). Cells were incubated with primary antibodies for 3 hours at room temperature. Cells were stained for beta-III Tubulin using the NorthernLights™ 557-conjugated Anti-Mouse IgG Secondary Antibody (red; NL007) and for Nestin using the NorthernLights 493-conjugated Anti-Goat IgG Secondary Antibody (green; NL003). Tissue was counterstained with DAPI (blue). View our protocol for Fluorescent ICC Staining of Cells on Coverslips.
beta ‑III Tubulin in Human Brain.
beta -III Tubulin was detected in immersion fixed paraffin-embedded sections of human brain (cerebellum) using Mouse Anti-Neuron-specific beta -III Tubulin Monoclonal Antibody (Catalog # MAB1195) at 8 µg/mL for 1 hour at room temperature followed by incubation with the Anti-Mouse IgG VisUCyte™ HRP Polymer Antibody (VC001). Tissue was stained using DAB (brown) and counterstained with hematoxylin (blue). Specific staining was localized to Purkinje neurons. View our protocol for IHC Staining with VisUCyte HRP Polymer Detection Reagents.
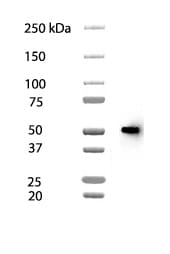
Detection of Rat beta ‑III Tubulin by Simple WesternTM.
Simple Western lane view shows lysates of rat cortical neurons, loaded at 0.2 mg/mL. A specific band was detected for beta ‑III Tubulin at approximately 56 kDa (as indicated) using 10 µg/mL of Mouse Anti-Neuron-specific beta ‑III Tubulin Monoclonal Antibody (Catalog # MAB1195). This experiment was conducted under reducing conditions and using the 12-230 kDa separation system.
Detection of beta ‑III Tubulin in Human Brain Cerebellum.
beta ‑III Tubulin was detected in immersion fixed paraffin-embedded sections of Human Brain Cerebellum using Mouse Anti-Neuron-specific beta ‑III Tubulin Monoclonal Antibody (Catalog # MAB1195) at 1 µg/mL for 1 hour at room temperature followed by incubation with the Anti-Mouse IgG VisUCyte™ HRP Polymer Antibody (Catalog # VC001). Before incubation with the primary antibody, tissue was subjected to heat-induced epitope retrieval using VisUCyte Antigen Retrieval Reagent-Basic (Catalog # VCTS021). Tissue was stained using DAB (brown) and counterstained with hematoxylin (blue). Specific staining was localized to Purkinje neurons. View our protocol for IHC Staining with VisUCyte HRP Polymer Detection Reagents. & HEL 92.1.7 cells (Negative).")
Detection of beta ‑III Tubulin in SH‑SY5Y cells (Positive) & HEL 92.1.7 cells (Negative).
beta ‑III Tubulin was detected in immersion fixed SH‑SY5Y human neuroblastoma cells (Positive) & absent in HEL 92.1.7 human erythroleukemic cells (Negative) using Mouse Anti-Neuron-specific beta ‑III Tubulin Monoclonal Antibody (Catalog # MAB1195) at 0.5 µg/mL for 3 hours at room temperature. Cells were stained using the NorthernLights™ 557-conjugated Anti-Mouse IgG Secondary Antibody (red; Catalog # NL007) and counterstained with DAPI (blue). Specific staining was localized to cell cytoplasm. View our protocol for Fluorescent ICC Staining of Non-adherent Cells.
Detection of Mouse beta-III Tubulin by Immunocytochemistry/Immunofluorescence
Representative immunocytochemistry demonstrating the expression of neuronal, synaptic, glutamatergic, GABAergic, and glial markers in cultures 21 days after plating. Neuronal cultures were immunostained against beta -III Tubulin (A–F); SNAP-25 (A); SV2 isoform A–C (A,B); polysialo gangliosides GD1a and GT1b/2b (C) Syn1 (D,E); glutamatergic neurons (VGLUT2, D); GABAergic neurons (GAD1, E) and glial cells (GFAP, F). Shown also are DAPI nuclear staining and the merged images. Scale bar is 10 μm (A–E), respectively, 25 μm for the bottom panel (F). Image collected and cropped by CiteAb from the following publication (https://pubmed.ncbi.nlm.nih.gov/28280466), licensed under a CC-BY license. Not internally tested by R&D Systems.
Detection of Human beta-III Tubulin by Immunocytochemistry/Immunofluorescence
Neuronal markers expressed by iPSC-NSCs after differentiation and maturation on PEG hydrogels.(a) beta III-tubulin (red), GAD 65/67 (green), and DAPI (nuclei, blue). Single channel grayscale images from (a) are shown for (b) beta III-tubulin and (c) GAD 65/67. (d) VGLUT2 (red), MAP2 (green), and DAPI (nuclei, blue). Single channel grayscale images from (d) are shown for (e) VGLUT2 and (f) MAP2. (g) beta III-tubulin (red), GABA (green), and DAPI (nuclei, blue). Single channel grayscale images from (g) are shown for (h) beta III-tubulin and (i) GABA. (j) MNX1/HB9 (green) and DAPI (nuclei, blue). Single channel grayscale images from (j) are shown for (k) MNX1/HB9 and (l) DAPI. (m) beta III-tubulin (red), Synapsophysin (green), and DAPI (nuclei, blue). Single channel grayscale images from (m) are shown for (n) beta III-tubulin and (o) Synapsophysin. (p) Synapsin-1 (green) and DAPI (nuclei, blue). Single channel grayscale images from (p) are shown for (q) Synapsin-1 and (r) DAPI. Scale Bars: 200 μm. Image collected and cropped by CiteAb from the following publication (https://pubmed.ncbi.nlm.nih.gov/26411797), licensed under a CC-BY license. Not internally tested by R&D Systems.
Detection of Human beta-III Tubulin by Immunocytochemistry/Immunofluorescence
I alpha I maintains pluripotency and differentiation capacity in long-term culture.Immunofluorescence staining of H207 hES cell line for (a) stem cell markers Oct4 (green), Sox2 (green), Nanog (red) and SSEA-4 (green) after 16 passages in E8:I alpha I, and for the three germ layers after 4 weeks of differentiation through embryoid body (EB) formation: mesoderm with alpha smooth muscle actin (SMA, green), ectoderm with Nestin (red) and beta -III-tubulin (green) and endoderm with alpha-fetoprotein (AFP, green) and PDGF-receptor (red), and (b) after endoderm directed differentiation for endoderm markers Sox7 (red), Sox17 (green) and HNF3 beta (green) and stem cell markers Oct4 (green) and Nanog (red), as well as negative control with secondary antibodies. All samples were co-stained with DAPI (Blue) for nuclei detection. Scale bars show 100 μm, white boxes show close-up images. Image collected and cropped by CiteAb from the following publication (https://www.nature.com/articles/ncomms12170), licensed under a CC-BY license. Not internally tested by R&D Systems.
Detection of Human beta-III Tubulin by Immunocytochemistry/Immunofluorescence
Neuronal markers expressed by iPSC-NSCs after differentiation and maturation on PEG hydrogels.(a) beta III-tubulin (red), GAD 65/67 (green), and DAPI (nuclei, blue). Single channel grayscale images from (a) are shown for (b) beta III-tubulin and (c) GAD 65/67. (d) VGLUT2 (red), MAP2 (green), and DAPI (nuclei, blue). Single channel grayscale images from (d) are shown for (e) VGLUT2 and (f) MAP2. (g) beta III-tubulin (red), GABA (green), and DAPI (nuclei, blue). Single channel grayscale images from (g) are shown for (h) beta III-tubulin and (i) GABA. (j) MNX1/HB9 (green) and DAPI (nuclei, blue). Single channel grayscale images from (j) are shown for (k) MNX1/HB9 and (l) DAPI. (m) beta III-tubulin (red), Synapsophysin (green), and DAPI (nuclei, blue). Single channel grayscale images from (m) are shown for (n) beta III-tubulin and (o) Synapsophysin. (p) Synapsin-1 (green) and DAPI (nuclei, blue). Single channel grayscale images from (p) are shown for (q) Synapsin-1 and (r) DAPI. Scale Bars: 200 μm. Image collected and cropped by CiteAb from the following publication (https://pubmed.ncbi.nlm.nih.gov/26411797), licensed under a CC-BY license. Not internally tested by R&D Systems.
Detection of Human beta-III Tubulin by Immunocytochemistry/Immunofluorescence
Characterization of NSCs and cortical neurons derived from FKRP‐ and CRISPR/Cas9 corrected‐iPSCsA, BRepresentative images of NSCs derived from FKRP‐ and corrected‐iPSC lines expressing SOX1, SOX2, and nestin.C, DQuantification of percentage of SOX1+ (C) and SOX2+ (D) cells in culture. The efficiency of neural induction is more than 99% in FKRP‐ and corrected‐iPSC (5D17, 5D23, and 3B17) lines. Data are mean ± s.d. n = 4 technical replicates.E, FFKRP‐ and corrected‐NSC lines can be further differentiated to cortical neural progenitor cells, expressing PAX6, OTX2, and vimentin.G–IQuantification of percentage of PAX6+ (G) and OTX2+ (H) cells in culture. About 91‐98% of cells derived from FKRP, 5D17, 5D23, and 3B17 NSC lines express PAX6 (G). About 93‐96% of cells derived from FKRP, 5D17, 5D23, and 3B17 NSC lines express OTX2 (H). Of the OTX2+ population, about 60‐67% cells are also Ki67+ cycling progenitors (I). Data are mean ± s.d. n = 4 technical replicates.J, KGlutamatergic projection neurons derived from FKRP and corrected (5D17, 5D23, and 3B17) progenitor cells. The vast majority of neurons contain vGlut1+ punctae in their neurites (labeled by Tuj1). Right panels are enlarged images from the insets of left panels.Data information: Scale bars, 50 μm. Image collected and cropped by CiteAb from the following publication (https://pubmed.ncbi.nlm.nih.gov/31566294), licensed under a CC-BY license. Not internally tested by R&D Systems.
Detection of Human beta-III Tubulin by Immunocytochemistry/Immunofluorescence
Expression of NSUN2 in the Human Developing Brain and NES Cells(A) DAPI-stained human embryo (6 weeks of gestation) marked for prosencephalon, mesencephalon, and rhombencephalon. Region in square is magnified in (B). Scale bar, 1 mm.(B) Prosencephalon labeled for NSUN2 and SOX1. Region in squares are magnified in (b′) and (b″). Arrows indicate NSUN2-positive cells. Scale bar, 100 μm.(C–F) Bright-field image (C) and immunofluorescence (D–F) of AF22 (upper panels) and Sai1 (lower panels) cells labeled for Nestin (D), SOX2 (E), and beta III-tubulin (F). Scale bar, 50 μm.(G and H) NES cells co-labeled for NSUN2 and Nestin (NES) (G) or SOX1 (H).(I) Differentiation protocol.(J–L) Differentiated AF22 and Sai1 cells (day 15) labeled for Nestin (NES; J), SOX2 (K), and beta III-tubulin (L). Scale bars: 50 μm.(M) Western blot for NSUN2, beta III-tubulin (TUBB3), GFAP, SOX2, and Nestin during differentiation (days). alpha -Tubulin served as loading control.Nuclei are counterstained with DAPI (A, B, D–F, J–L). Image collected and cropped by CiteAb from the following publication (https://linkinghub.elsevier.com/retrieve/pii/S2213671116302764), licensed under a CC-BY license. Not internally tested by R&D Systems.
Detection of Human beta-III Tubulin by Immunocytochemistry/Immunofluorescence
Functional glycosylation of alpha ‐dystroglycan and characterization of dystroglycanopathy patient‐specific iPSCsCurrent model of the core M3 functional glycan structure on alpha ‐dystroglycan and enzymes involved in its synthesis. ECM ligands, such as laminins, bind to the Xyl‐GlucA disaccharide repeats (IIH6 epitope). Man, mannose; GlcNAc, N‐acetylglucosamine; GalNAc, N‐acetylgalactosamine; Rbo5P, ribitol‐5‐phosphate; Xyl, xylose; GlcA, glucuronic acid.Representative images of immunostaining demonstrate that FKRP‐iPSCs express specific pluripotency‐associated markers, including NANOG, OCT4, Tra‐1‐60, and SSEA4.FKRP‐iPSCs have a normal karyotype.In vitro differentiation of FKRP‐iPSCs to cells representing ectoderm ( beta ‐III Tubulin, Tuj1), mesoderm (SMA, smooth muscle actin), and endoderm (AFP, alpha ‐fetoprotein).Data information: Scale bars, 50 μm. Image collected and cropped by CiteAb from the following publication (https://pubmed.ncbi.nlm.nih.gov/31566294), licensed under a CC-BY license. Not internally tested by R&D Systems.
Detection of Mouse beta-III Tubulin by Immunocytochemistry/Immunofluorescence
Representative immunocytochemistry demonstrating the expression of neuronal, synaptic, glutamatergic, GABAergic, and glial markers in cultures 21 days after plating. Neuronal cultures were immunostained against beta -III Tubulin (A–F); SNAP-25 (A); SV2 isoform A–C (A,B); polysialo gangliosides GD1a and GT1b/2b (C) Syn1 (D,E); glutamatergic neurons (VGLUT2, D); GABAergic neurons (GAD1, E) and glial cells (GFAP, F). Shown also are DAPI nuclear staining and the merged images. Scale bar is 10 μm (A–E), respectively, 25 μm for the bottom panel (F). Image collected and cropped by CiteAb from the following publication (https://pubmed.ncbi.nlm.nih.gov/28280466), licensed under a CC-BY license. Not internally tested by R&D Systems.
Detection of Human beta-III Tubulin by Western Blot
Expression of NSUN2 in the Human Developing Brain and NES Cells(A) DAPI-stained human embryo (6 weeks of gestation) marked for prosencephalon, mesencephalon, and rhombencephalon. Region in square is magnified in (B). Scale bar, 1 mm.(B) Prosencephalon labeled for NSUN2 and SOX1. Region in squares are magnified in (b′) and (b″). Arrows indicate NSUN2-positive cells. Scale bar, 100 μm.(C–F) Bright-field image (C) and immunofluorescence (D–F) of AF22 (upper panels) and Sai1 (lower panels) cells labeled for Nestin (D), SOX2 (E), and beta III-tubulin (F). Scale bar, 50 μm.(G and H) NES cells co-labeled for NSUN2 and Nestin (NES) (G) or SOX1 (H).(I) Differentiation protocol.(J–L) Differentiated AF22 and Sai1 cells (day 15) labeled for Nestin (NES; J), SOX2 (K), and beta III-tubulin (L). Scale bars: 50 μm.(M) Western blot for NSUN2, beta III-tubulin (TUBB3), GFAP, SOX2, and Nestin during differentiation (days). alpha -Tubulin served as loading control.Nuclei are counterstained with DAPI (A, B, D–F, J–L). Image collected and cropped by CiteAb from the following publication (https://linkinghub.elsevier.com/retrieve/pii/S2213671116302764), licensed under a CC-BY license. Not internally tested by R&D Systems.
Detection of Human beta-III Tubulin by Immunocytochemistry/Immunofluorescence
Characterization of NSCs and cortical neurons derived from FKRP‐ and CRISPR/Cas9 corrected‐iPSCsA, BRepresentative images of NSCs derived from FKRP‐ and corrected‐iPSC lines expressing SOX1, SOX2, and nestin.C, DQuantification of percentage of SOX1+ (C) and SOX2+ (D) cells in culture. The efficiency of neural induction is more than 99% in FKRP‐ and corrected‐iPSC (5D17, 5D23, and 3B17) lines. Data are mean ± s.d. n = 4 technical replicates.E, FFKRP‐ and corrected‐NSC lines can be further differentiated to cortical neural progenitor cells, expressing PAX6, OTX2, and vimentin.G–IQuantification of percentage of PAX6+ (G) and OTX2+ (H) cells in culture. About 91‐98% of cells derived from FKRP, 5D17, 5D23, and 3B17 NSC lines express PAX6 (G). About 93‐96% of cells derived from FKRP, 5D17, 5D23, and 3B17 NSC lines express OTX2 (H). Of the OTX2+ population, about 60‐67% cells are also Ki67+ cycling progenitors (I). Data are mean ± s.d. n = 4 technical replicates.J, KGlutamatergic projection neurons derived from FKRP and corrected (5D17, 5D23, and 3B17) progenitor cells. The vast majority of neurons contain vGlut1+ punctae in their neurites (labeled by Tuj1). Right panels are enlarged images from the insets of left panels.Data information: Scale bars, 50 μm. Image collected and cropped by CiteAb from the following publication (https://pubmed.ncbi.nlm.nih.gov/31566294), licensed under a CC-BY license. Not internally tested by R&D Systems.
Detection of Mouse beta-III Tubulin by Immunocytochemistry/Immunofluorescence
Representative immunocytochemistry demonstrating the expression of neuronal, synaptic, glutamatergic, GABAergic, and glial markers in cultures 21 days after plating. Neuronal cultures were immunostained against beta -III Tubulin (A–F); SNAP-25 (A); SV2 isoform A–C (A,B); polysialo gangliosides GD1a and GT1b/2b (C) Syn1 (D,E); glutamatergic neurons (VGLUT2, D); GABAergic neurons (GAD1, E) and glial cells (GFAP, F). Shown also are DAPI nuclear staining and the merged images. Scale bar is 10 μm (A–E), respectively, 25 μm for the bottom panel (F). Image collected and cropped by CiteAb from the following publication (https://pubmed.ncbi.nlm.nih.gov/28280466), licensed under a CC-BY license. Not internally tested by R&D Systems.
Detection of Human beta-III Tubulin by Immunocytochemistry/Immunofluorescence
Neuronal markers expressed by iPSC-NSCs after differentiation and maturation on PEG hydrogels.(a) beta III-tubulin (red), GAD 65/67 (green), and DAPI (nuclei, blue). Single channel grayscale images from (a) are shown for (b) beta III-tubulin and (c) GAD 65/67. (d) VGLUT2 (red), MAP2 (green), and DAPI (nuclei, blue). Single channel grayscale images from (d) are shown for (e) VGLUT2 and (f) MAP2. (g) beta III-tubulin (red), GABA (green), and DAPI (nuclei, blue). Single channel grayscale images from (g) are shown for (h) beta III-tubulin and (i) GABA. (j) MNX1/HB9 (green) and DAPI (nuclei, blue). Single channel grayscale images from (j) are shown for (k) MNX1/HB9 and (l) DAPI. (m) beta III-tubulin (red), Synapsophysin (green), and DAPI (nuclei, blue). Single channel grayscale images from (m) are shown for (n) beta III-tubulin and (o) Synapsophysin. (p) Synapsin-1 (green) and DAPI (nuclei, blue). Single channel grayscale images from (p) are shown for (q) Synapsin-1 and (r) DAPI. Scale Bars: 200 μm. Image collected and cropped by CiteAb from the following publication (https://pubmed.ncbi.nlm.nih.gov/26411797), licensed under a CC-BY license. Not internally tested by R&D Systems.
Detection of Mouse beta-III Tubulin by Immunocytochemistry/Immunofluorescence
Representative immunocytochemistry demonstrating the expression of neuronal, synaptic, glutamatergic, GABAergic, and glial markers in cultures 21 days after plating. Neuronal cultures were immunostained against beta -III Tubulin (A–F); SNAP-25 (A); SV2 isoform A–C (A,B); polysialo gangliosides GD1a and GT1b/2b (C) Syn1 (D,E); glutamatergic neurons (VGLUT2, D); GABAergic neurons (GAD1, E) and glial cells (GFAP, F). Shown also are DAPI nuclear staining and the merged images. Scale bar is 10 μm (A–E), respectively, 25 μm for the bottom panel (F). Image collected and cropped by CiteAb from the following publication (https://pubmed.ncbi.nlm.nih.gov/28280466), licensed under a CC-BY license. Not internally tested by R&D Systems.
Detection of Mouse beta-III Tubulin by Immunocytochemistry/Immunofluorescence
Differentiation of murine skin stem cell precursors (SKP).The differentiation of SKPs was induced through the dissociation of cell aggregates into single cells followed by serum exposure and, as may be seen in the micrographs after 7 days (A), 14 days (B) and 21 days (C), these cells presented several elongated extensions. The mRNA levels of astrocyte markers (D) GFAP; oligodendrocytes (E) CNPase; and neurons (F) beta III tubulin were measured by qRT-PCR and validated at the protein level (G) by immunofluorescence microscopy, Bar = 50μm. The results are presented as the mean ± SD of values obtained in three independent experiments performed in triplicates. Statistical analyzes were performed using ANOVA analysis of variance followed by Tukey test to post-Kramer. All groups were measured versus the undifferentiated control in the shortest time of differentiation, ns = not significant; * p ≤ 0.05; ** p≤0.001. Image collected and cropped by CiteAb from the following publication (https://dx.plos.org/10.1371/journal.pone.0140143), licensed under a CC-BY license. Not internally tested by R&D Systems.
Detection of Human beta-III Tubulin by Immunocytochemistry/Immunofluorescence
Neuronal markers expressed by iPSC-NSCs after differentiation and maturation on PEG hydrogels.(a) beta III-tubulin (red), GAD 65/67 (green), and DAPI (nuclei, blue). Single channel grayscale images from (a) are shown for (b) beta III-tubulin and (c) GAD 65/67. (d) VGLUT2 (red), MAP2 (green), and DAPI (nuclei, blue). Single channel grayscale images from (d) are shown for (e) VGLUT2 and (f) MAP2. (g) beta III-tubulin (red), GABA (green), and DAPI (nuclei, blue). Single channel grayscale images from (g) are shown for (h) beta III-tubulin and (i) GABA. (j) MNX1/HB9 (green) and DAPI (nuclei, blue). Single channel grayscale images from (j) are shown for (k) MNX1/HB9 and (l) DAPI. (m) beta III-tubulin (red), Synapsophysin (green), and DAPI (nuclei, blue). Single channel grayscale images from (m) are shown for (n) beta III-tubulin and (o) Synapsophysin. (p) Synapsin-1 (green) and DAPI (nuclei, blue). Single channel grayscale images from (p) are shown for (q) Synapsin-1 and (r) DAPI. Scale Bars: 200 μm. Image collected and cropped by CiteAb from the following publication (https://pubmed.ncbi.nlm.nih.gov/26411797), licensed under a CC-BY license. Not internally tested by R&D Systems.
Detection of Human beta-III Tubulin by Immunocytochemistry/Immunofluorescence
Expression of NSUN2 in the Human Developing Brain and NES Cells(A) DAPI-stained human embryo (6 weeks of gestation) marked for prosencephalon, mesencephalon, and rhombencephalon. Region in square is magnified in (B). Scale bar, 1 mm.(B) Prosencephalon labeled for NSUN2 and SOX1. Region in squares are magnified in (b′) and (b″). Arrows indicate NSUN2-positive cells. Scale bar, 100 μm.(C–F) Bright-field image (C) and immunofluorescence (D–F) of AF22 (upper panels) and Sai1 (lower panels) cells labeled for Nestin (D), SOX2 (E), and beta III-tubulin (F). Scale bar, 50 μm.(G and H) NES cells co-labeled for NSUN2 and Nestin (NES) (G) or SOX1 (H).(I) Differentiation protocol.(J–L) Differentiated AF22 and Sai1 cells (day 15) labeled for Nestin (NES; J), SOX2 (K), and beta III-tubulin (L). Scale bars: 50 μm.(M) Western blot for NSUN2, beta III-tubulin (TUBB3), GFAP, SOX2, and Nestin during differentiation (days). alpha -Tubulin served as loading control.Nuclei are counterstained with DAPI (A, B, D–F, J–L). Image collected and cropped by CiteAb from the following publication (https://linkinghub.elsevier.com/retrieve/pii/S2213671116302764), licensed under a CC-BY license. Not internally tested by R&D Systems.
Detection of Human beta-III Tubulin by Immunocytochemistry/Immunofluorescence
Neuronal markers expressed by iPSC-NSCs after differentiation and maturation on PEG hydrogels.(a) beta III-tubulin (red), GAD 65/67 (green), and DAPI (nuclei, blue). Single channel grayscale images from (a) are shown for (b) beta III-tubulin and (c) GAD 65/67. (d) VGLUT2 (red), MAP2 (green), and DAPI (nuclei, blue). Single channel grayscale images from (d) are shown for (e) VGLUT2 and (f) MAP2. (g) beta III-tubulin (red), GABA (green), and DAPI (nuclei, blue). Single channel grayscale images from (g) are shown for (h) beta III-tubulin and (i) GABA. (j) MNX1/HB9 (green) and DAPI (nuclei, blue). Single channel grayscale images from (j) are shown for (k) MNX1/HB9 and (l) DAPI. (m) beta III-tubulin (red), Synapsophysin (green), and DAPI (nuclei, blue). Single channel grayscale images from (m) are shown for (n) beta III-tubulin and (o) Synapsophysin. (p) Synapsin-1 (green) and DAPI (nuclei, blue). Single channel grayscale images from (p) are shown for (q) Synapsin-1 and (r) DAPI. Scale Bars: 200 μm. Image collected and cropped by CiteAb from the following publication (https://pubmed.ncbi.nlm.nih.gov/26411797), licensed under a CC-BY license. Not internally tested by R&D Systems.
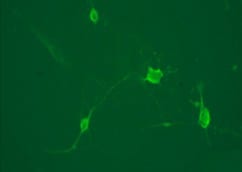
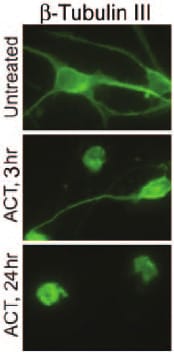
Detection of Mouse Neuron-specific beta-III Tubulin Antibody by Immunocytochemistry/ Immunofluorescence
Differentiation of murine skin stem cell precursors (SKP).The differentiation of SKPs was induced through the dissociation of cell aggregates into single cells followed by serum exposure and, as may be seen in the micrographs after 7 days (A), 14 days (B) and 21 days (C), these cells presented several elongated extensions. The mRNA levels of astrocyte markers (D) GFAP; oligodendrocytes (E) CNPase; and neurons (F) beta III tubulin were measured by qRT-PCR and validated at the protein level (G) by immunofluorescence microscopy, Bar = 50μm. The results are presented as the mean ± SD of values obtained in three independent experiments performed in triplicates. Statistical analyzes were performed using ANOVA analysis of variance followed by Tukey test to post-Kramer. All groups were measured versus the undifferentiated control in the shortest time of differentiation, ns = not significant; * p ≤ 0.05; ** p≤0.001. Image collected and cropped by CiteAb from the following publication (https://pubmed.ncbi.nlm.nih.gov/26462205), licensed under a CC-BY license. Not internally tested by R&D Systems.
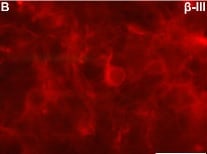
Detection of Mouse Neuron-specific beta-III Tubulin Antibody by Immunohistochemistry
CTCL is associated with nerve innervations in mouse lymphoma.(A) Double immunostaining for CGRP and beta –tubulin III in the back skin with lymphoma from a CTCL mouse at day 20. Dotted lines show the epidermis. Scale bar: 25 μm. (B) Immunostaining for NF200 in the tumor from a CTCL mouse at day 20. Dotted lines show the epidermis. Scale bar: 25 μm. (C) 3D reconstruction of innervated nerves in a beta –tubulin III–labeled tumor from a CTCL mouse at day 20. Scale bar: 300 μm. (D) High-magnification image of the boxed area in C. Scale bar: 150 μm. Image collected and cropped by CiteAb from the following publication (https://pubmed.ncbi.nlm.nih.gov/36520531), licensed under a CC-BY license. Not internally tested by R&D Systems.
Detection of Human Neuron-specific beta-III Tubulin Antibody by Immunocytochemistry/ Immunofluorescence
Expression of NSUN2 in the Human Developing Brain and NES Cells(A) DAPI-stained human embryo (6 weeks of gestation) marked for prosencephalon, mesencephalon, and rhombencephalon. Region in square is magnified in (B). Scale bar, 1 mm.(B) Prosencephalon labeled for NSUN2 and SOX1. Region in squares are magnified in (b′) and (b″). Arrows indicate NSUN2-positive cells. Scale bar, 100 μm.(C–F) Bright-field image (C) and immunofluorescence (D–F) of AF22 (upper panels) and Sai1 (lower panels) cells labeled for Nestin (D), SOX2 (E), and beta III-tubulin (F). Scale bar, 50 μm.(G and H) NES cells co-labeled for NSUN2 and Nestin (NES) (G) or SOX1 (H).(I) Differentiation protocol.(J–L) Differentiated AF22 and Sai1 cells (day 15) labeled for Nestin (NES; J), SOX2 (K), and beta III-tubulin (L). Scale bars: 50 μm.(M) Western blot for NSUN2, beta III-tubulin (TUBB3), GFAP, SOX2, and Nestin during differentiation (days). alpha -Tubulin served as loading control.Nuclei are counterstained with DAPI (A, B, D–F, J–L). Image collected and cropped by CiteAb from the following publication (https://pubmed.ncbi.nlm.nih.gov/28041877), licensed under a CC-BY license. Not internally tested by R&D Systems.
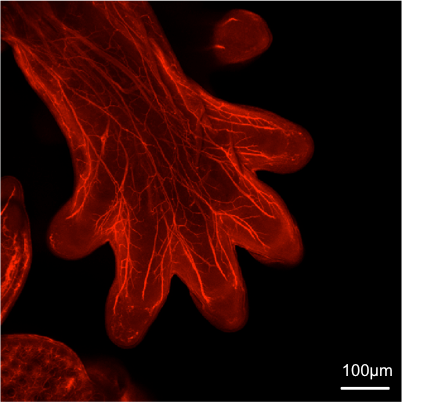
Detection of Human Neuron-specific beta-III Tubulin Antibody by Immunocytochemistry/ Immunofluorescence
I alpha I maintains pluripotency and differentiation capacity in long-term culture.Immunofluorescence staining of H207 hES cell line for (a) stem cell markers Oct4 (green), Sox2 (green), Nanog (red) and SSEA-4 (green) after 16 passages in E8:I alpha I, and for the three germ layers after 4 weeks of differentiation through embryoid body (EB) formation: mesoderm with alpha smooth muscle actin (SMA, green), ectoderm with Nestin (red) and beta -III-tubulin (green) and endoderm with alpha-fetoprotein (AFP, green) and PDGF-receptor (red), and (b) after endoderm directed differentiation for endoderm markers Sox7 (red), Sox17 (green) and HNF3 beta (green) and stem cell markers Oct4 (green) and Nanog (red), as well as negative control with secondary antibodies. All samples were co-stained with DAPI (Blue) for nuclei detection. Scale bars show 100 μm, white boxes show close-up images. Image collected and cropped by CiteAb from the following publication (https://pubmed.ncbi.nlm.nih.gov/27405751), licensed under a CC-BY license. Not internally tested by R&D Systems.
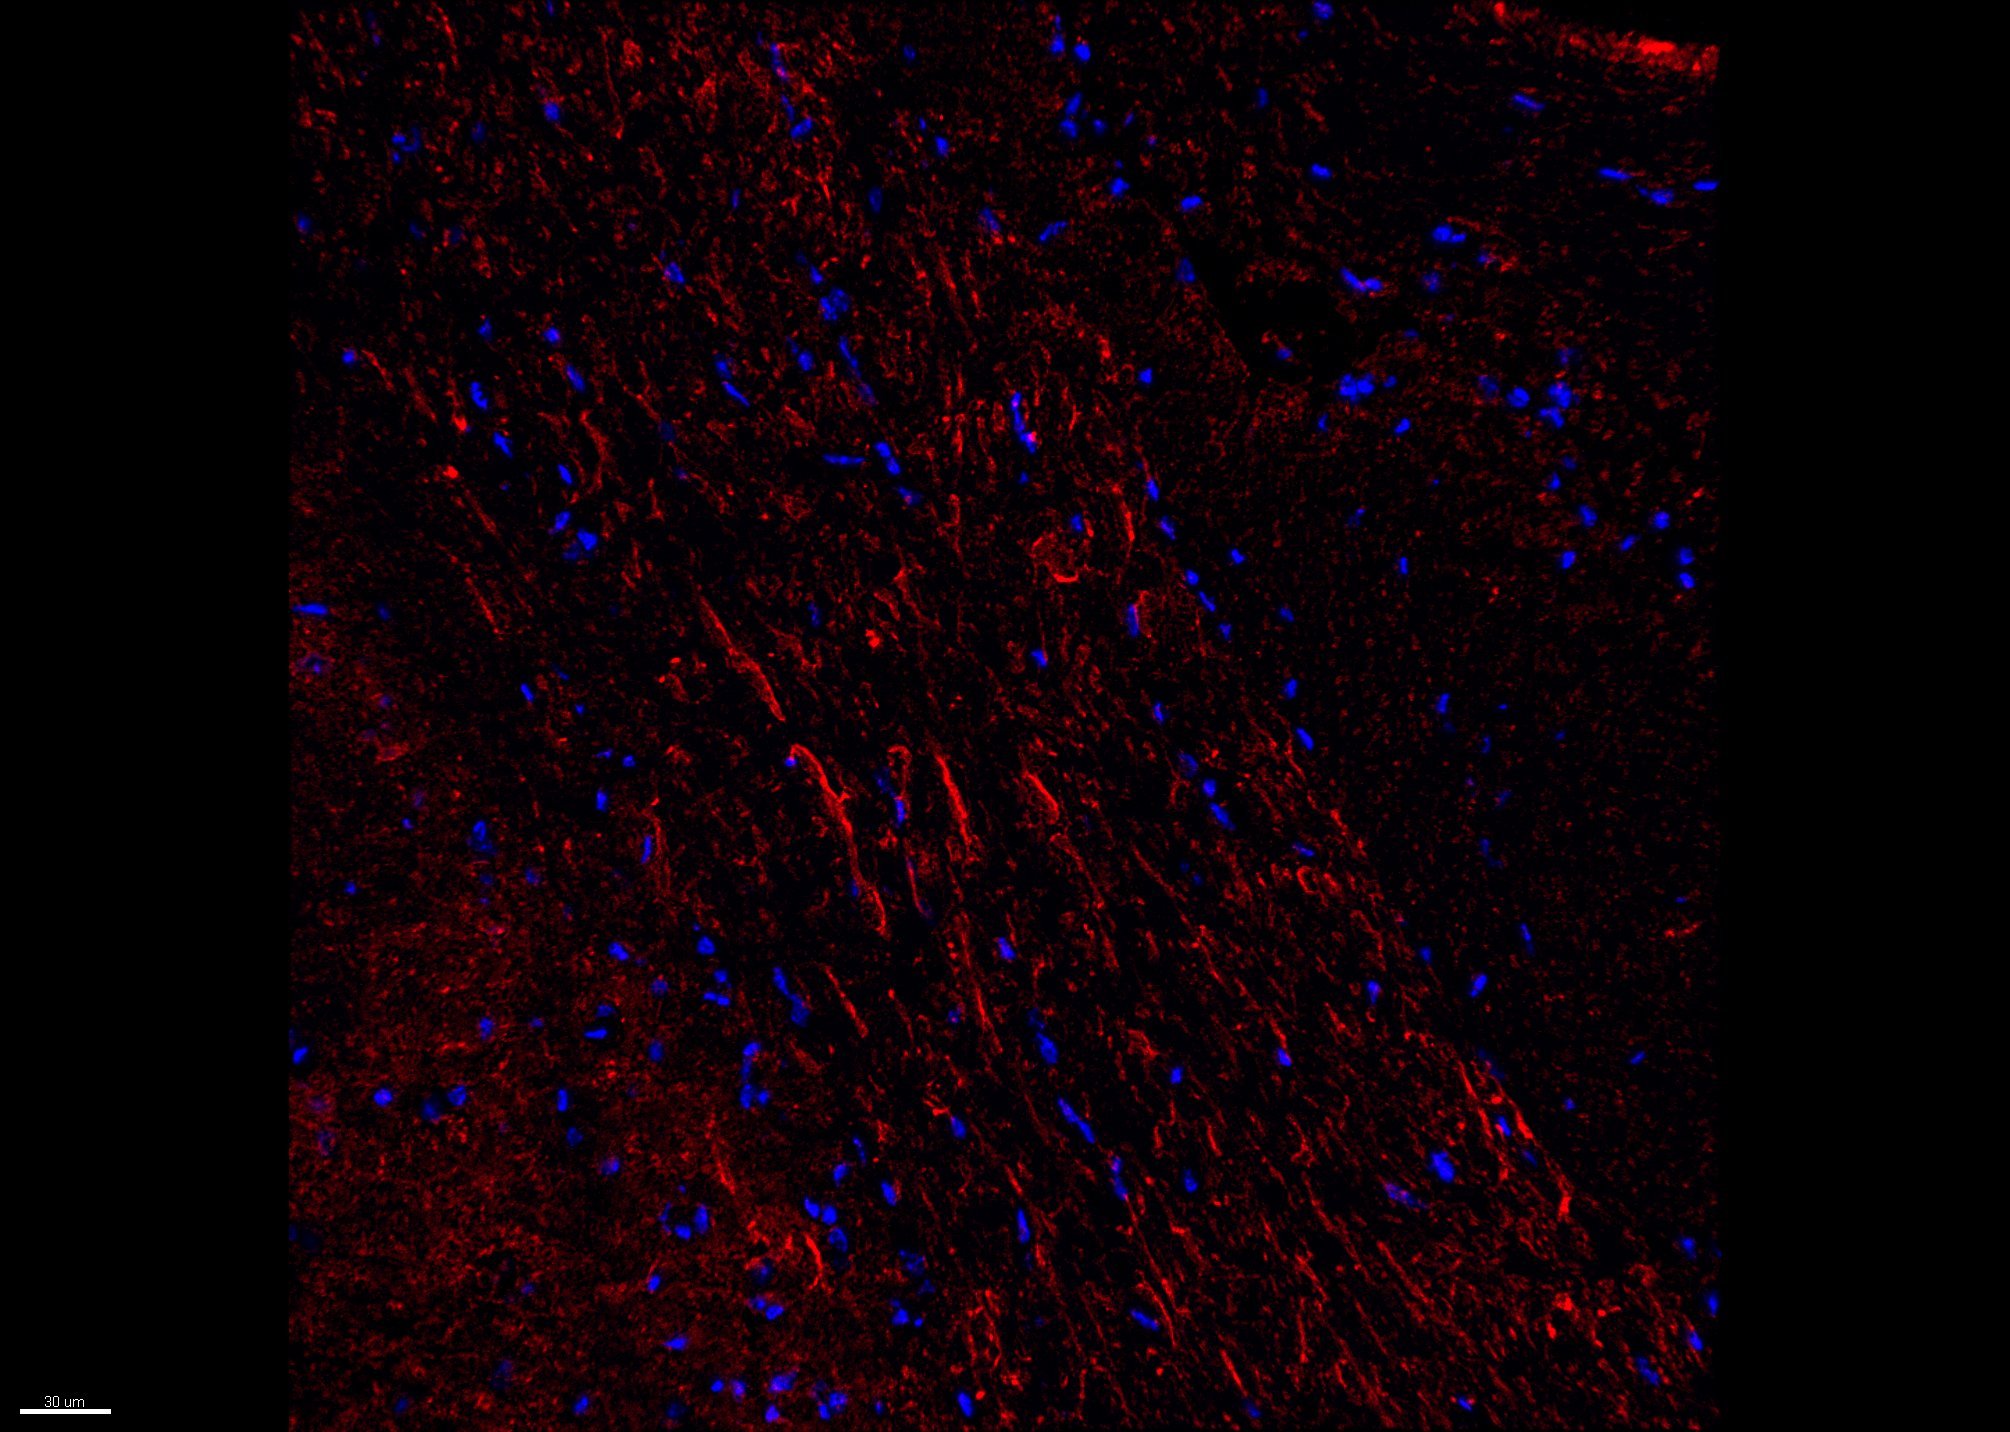
Detection of Mouse Neuron-specific beta-III Tubulin Antibody by Immunohistochemistry
CTCL is associated with nerve innervations in mouse lymphoma.(A) Double immunostaining for CGRP and beta –tubulin III in the back skin with lymphoma from a CTCL mouse at day 20. Dotted lines show the epidermis. Scale bar: 25 μm. (B) Immunostaining for NF200 in the tumor from a CTCL mouse at day 20. Dotted lines show the epidermis. Scale bar: 25 μm. (C) 3D reconstruction of innervated nerves in a beta –tubulin III–labeled tumor from a CTCL mouse at day 20. Scale bar: 300 μm. (D) High-magnification image of the boxed area in C. Scale bar: 150 μm. Image collected and cropped by CiteAb from the following publication (https://pubmed.ncbi.nlm.nih.gov/36520531), licensed under a CC-BY license. Not internally tested by R&D Systems.
Detection of Mouse beta-III Tubulin by Immunocytochemistry/ Immunofluorescence
Stabilized gamma -catenin suppresses neuronal differentiation in embryoid body assays and reduces overall tri-lineage differentiation efficiency.(A and B) Embryoid bodies were generated using control, beta -catS33A, and gamma -catS28A mESCs, and assayed for neuronal differentiation after 10 days. (A) Only WT EBs displayed immunofluorescent staining for the neuronal marker, beta -III-tubulin. (B) The transcript levels of the neuronal markers beta -III-tubulin, Nestin, Map2, Tyrosine hydroxylase, the endoderm marker alpha -Fetoprotein, and the mesoderm marker Cardiac Troponin, were reduced in EBs derived from mESCs overexpressing beta -catS33A or gamma -catS28A, as assessed by qRT-PCR analyses. Bars represent means and error bars indicate s.e.m. (n = 2). Size bar = 200 µm. Image collected and cropped by CiteAb from the following open publication (https://pubmed.ncbi.nlm.nih.gov/23724138), licensed under a CC-BY license. Not internally tested by R&D Systems.Applications for Neuron-specific beta-III Tubulin Antibody (TuJ-1)
Application
Recommended Usage
Immunocytochemistry
0.5-25 µg/mL
Sample: Immersion fixed rat cortical stem cells, rat cortical neurons, SH‑SY5Y human neuroblastoma cells (Positive) and HEL 92.1.7 human erythroleukemic cell line (Negative)
Sample: Immersion fixed rat cortical stem cells, rat cortical neurons, SH‑SY5Y human neuroblastoma cells (Positive) and HEL 92.1.7 human erythroleukemic cell line (Negative)
Immunohistochemistry
1-25 µg/mL
Sample: Immersion fixed paraffin-embedded sections of human brain (cerebellum)
Sample: Immersion fixed paraffin-embedded sections of human brain (cerebellum)
Intracellular Staining by Flow Cytometry
0.25 µg/106 cells
Sample: A172 human glioblastoma cell line
Sample: A172 human glioblastoma cell line
Simple Western
10 µg/mL
Sample: Rat cortical neurons
Sample: Rat cortical neurons
Western Blot
0.2 µg/mL
Sample: Human brain (cerebellum) tissue, human brain (hypothalamus) tissue, mouse brain (cerebellum) tissue, and mouse brain (stem) tissue
Sample: Human brain (cerebellum) tissue, human brain (hypothalamus) tissue, mouse brain (cerebellum) tissue, and mouse brain (stem) tissue
Reviewed Applications
Read 23 reviews rated 4.7 using MAB1195 in the following applications:
Flow Cytometry Panel Builder
Bio-Techne Knows Flow Cytometry
Save time and reduce costly mistakes by quickly finding compatible reagents using the Panel Builder Tool.
Advanced Features
- Spectra Viewer - Custom analysis of spectra from multiple fluorochromes
- Spillover Popups - Visualize the spectra of individual fluorochromes
- Antigen Density Selector - Match fluorochrome brightness with antigen density

Formulation, Preparation, and Storage
Purification
Protein A or G purified from hybridoma culture supernatant
Reconstitution
Reconstitute at 0.5 mg/mL in sterile PBS. For liquid material, refer to CoA for concentration.
Loading...
Formulation
Lyophilized from a 0.2 μm filtered solution in PBS with Trehalose. See Certificate of Analysis for details.
*Small pack size (-SP) is supplied either lyophilized or as a 0.2 µm filtered solution in PBS.
*Small pack size (-SP) is supplied either lyophilized or as a 0.2 µm filtered solution in PBS.
Shipping
Lyophilized product is shipped at ambient temperature. Liquid small pack size (-SP) is shipped with polar packs. Upon receipt, store immediately at the temperature recommended below.
Stability & Storage
Use a manual defrost freezer and avoid repeated freeze-thaw cycles.
- 12 months from date of receipt, -20 to -70 °C as supplied.
- 1 month, 2 to 8 °C under sterile conditions after reconstitution.
- 6 months, -20 to -70 °C under sterile conditions after reconstitution.
Calculators
Background: beta-III Tubulin
Alternate Names
beta-Tubulin III, Beta3-tubulin, betaIII Tubulin, Class III beta-tubulin, TUBB3, Tubulin Beta 3, Tubulin beta-4, Tubulin beta-III
Entrez Gene IDs
10381 (Human)
Gene Symbol
TUBB3
Additional beta-III Tubulin Products
Product Documents for Neuron-specific beta-III Tubulin Antibody (TuJ-1)
Certificate of Analysis
To download a Certificate of Analysis, please enter a lot or batch number in the search box below.
Note: Certificate of Analysis not available for kit components.
Product Specific Notices for Neuron-specific beta-III Tubulin Antibody (TuJ-1)
For research use only
Related Research Areas
Citations for Neuron-specific beta-III Tubulin Antibody (TuJ-1)
 Powered by Bioz
Customer Reviews for Neuron-specific beta-III Tubulin Antibody (TuJ-1) (23)
4.7 out of 5
23 Customer Ratings
Have you used Neuron-specific beta-III Tubulin Antibody (TuJ-1)?
Submit a review and receive an Amazon gift card!
$25/€18/£15/$25CAN/¥2500 Yen for a review with an image
$10/€7/£6/$10CAN/¥1110 Yen for a review without an image
Submit a review
Customer Images

Showing
1
-
5 of
23 reviews
Showing All
Filter By:
-
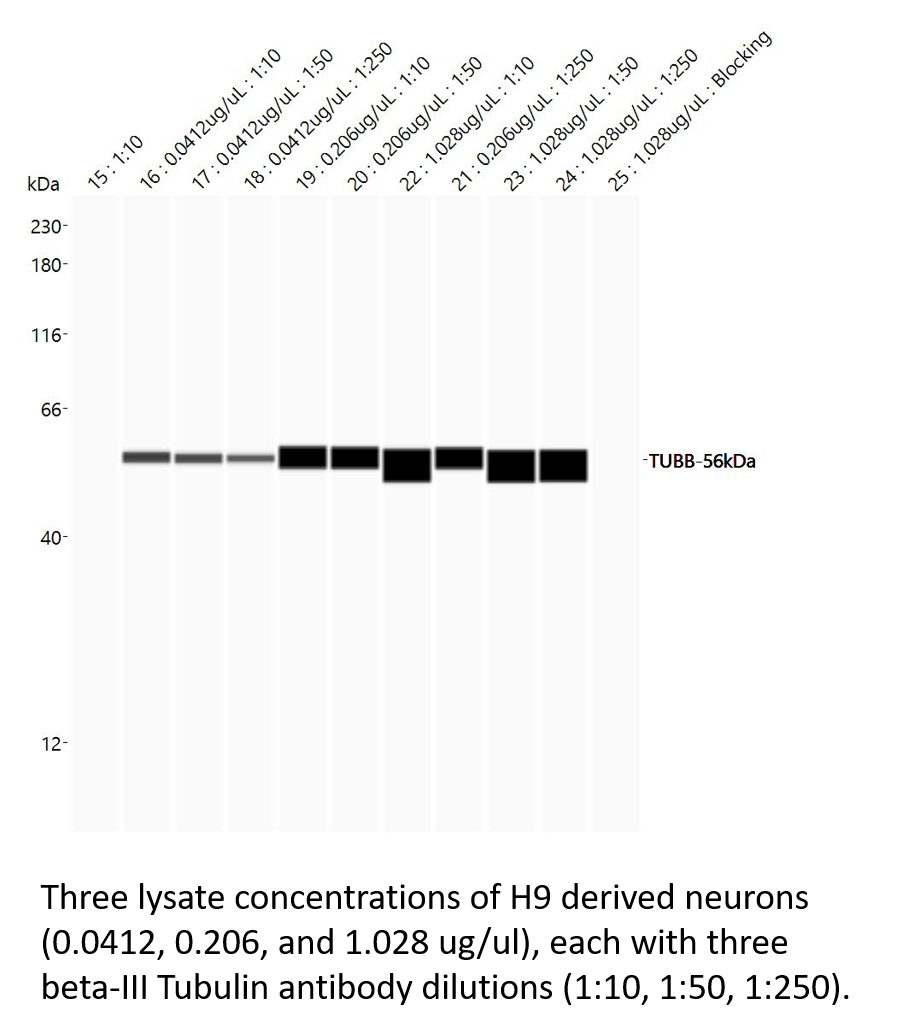
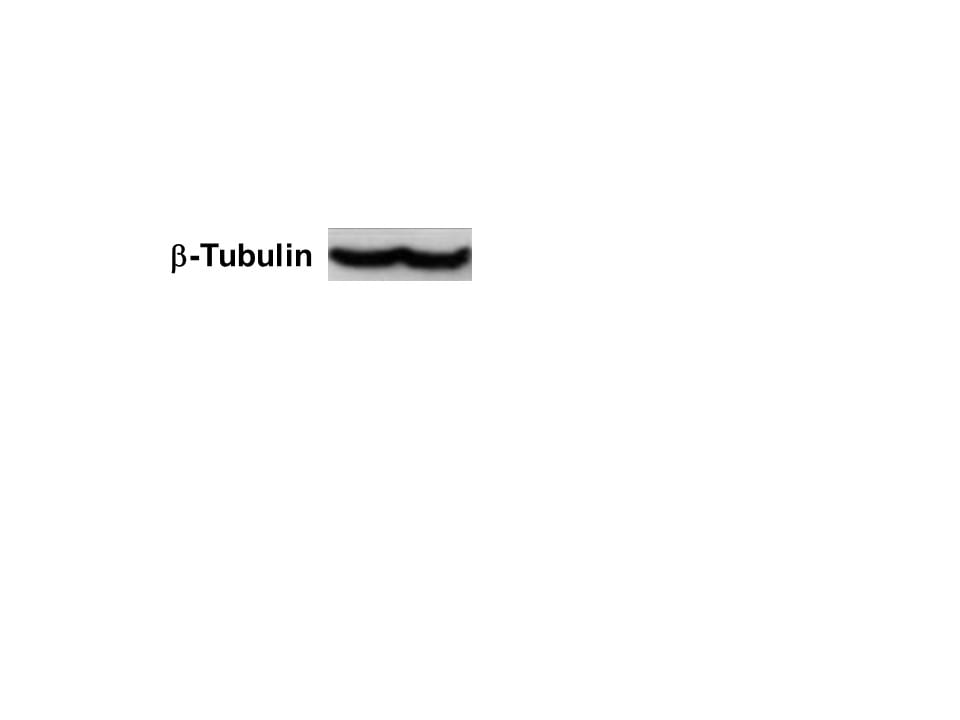
Application: Western BlotSample Tested: HCT-116 human colorectal carcinoma cell lineSpecies: HumanVerified Customer | Posted 02/03/2026Beta III-Tubulin band1:1000 dilution, clear band

-
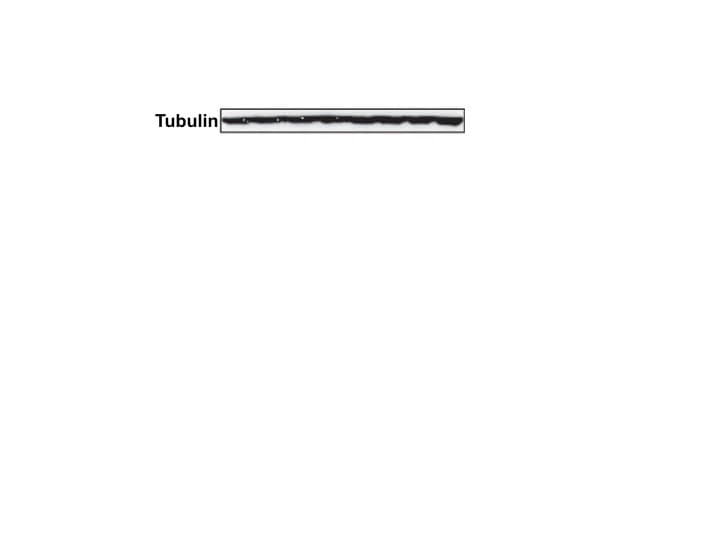
Application: Western BlotSample Tested: MDA-MB-231 human breast cancer cell lineSpecies: HumanVerified Customer | Posted 02/03/2026Band of b-Tubulin in MDA-231Very clear band with 1:1000 dilution
-
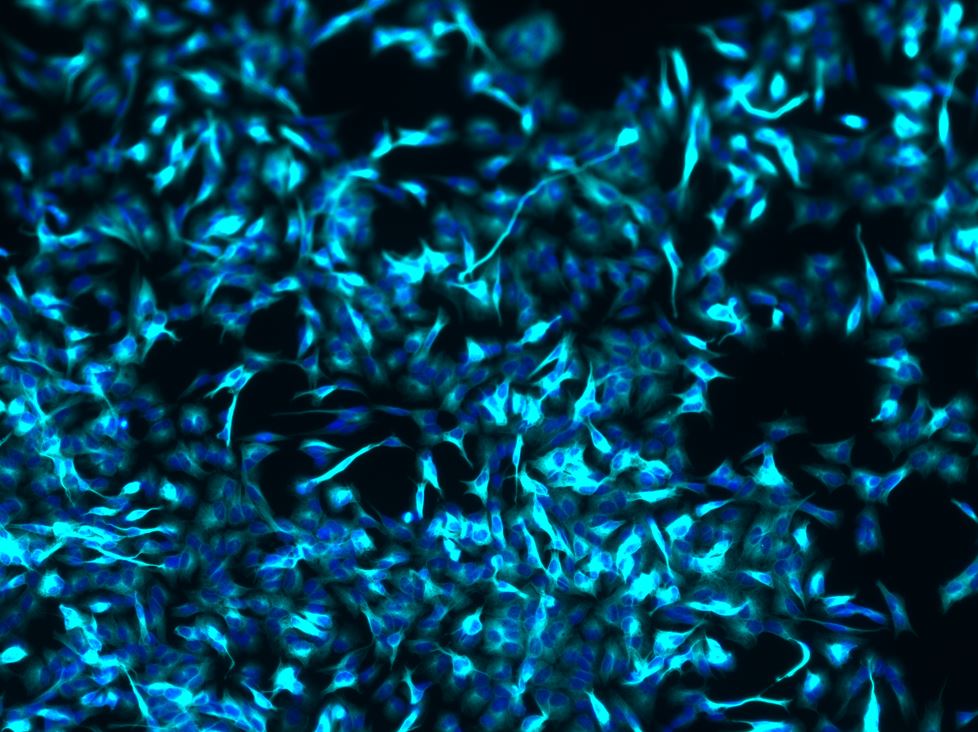
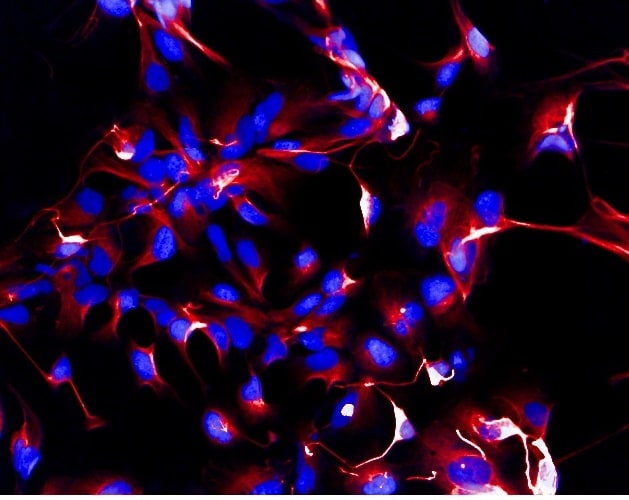
Application: ImmunocytochemistrySample Tested: Neuroblastoma cells SH-SY5Y differentiated into neuronsSpecies: HumanVerified Customer | Posted 05/25/2023SHSY5Y cells differentiated into neurons Cyan: Neuron-specific beta -III Tubulin Antibody diluted 1:100 in PBS-Triton 0.2%X-100/BSA 1%, 3 h, RT Blue: DAPI
-
Application: Immunocytochemistry/ImmunofluorescenceSample Tested: Fibroblast-like cellsSpecies: MouseVerified Customer | Posted 07/13/2021
-
Application: Immunocytochemistry/ImmunofluorescenceSample Tested: motor neuronSpecies: MouseVerified Customer | Posted 06/28/2021
-
Application: Immunocytochemistry/ImmunofluorescenceSample Tested: Cortical neuronsSpecies: MouseVerified Customer | Posted 05/04/2021
-
Application: Immunocytochemistry/ImmunofluorescenceSample Tested: EmbryoSpecies: MouseVerified Customer | Posted 11/22/2019Analysis of sensory fibre growth in vivo was carried out using iDISCO preparations (Renier et al., 2014, using RnD MAB1195,1:300, and anti-mouse 546 Alexa Fluor secondary antibody 1:300. Fantastic antibody across many applications.
-
Application: Immunofluorescence Acetone fixedSample Tested: Adult mouse brain tissueSpecies: MouseVerified Customer | Posted 01/17/2019Mouse brain stained for beta III tubulin (red) counterstained with DAPI (blue)
-
Application: Simple WesternSample Tested: Cortical neuronsSpecies: HumanVerified Customer | Posted 11/27/2018
-
Application: ImmunohistochemistrySample Tested: Cortical stem cellsSpecies: RatVerified Customer | Posted 04/24/2018
-
Application: ImmunohistochemistrySample Tested: SerumSpecies: MouseVerified Customer | Posted 04/13/2018
-
Application: Western BlotSample Tested: IPS2 induced pluripotent stem cellsSpecies: MouseVerified Customer | Posted 01/25/2018
-
Application: Western BlotSample Tested: IPS2 induced pluripotent stem cellsSpecies: MouseVerified Customer | Posted 01/25/2018
-
Application: Immunohistochemistry-FrozenSample Tested: Adult brainSpecies: FelineVerified Customer | Posted 11/02/2017Feline Brain was stained with MAB1195 at 1:100 and secondary antibody Alexa555 anti-mouse secondary antibody was used. The image was captured by epifluorescent microscope.
-
Application: Immunocytochemistry/ImmunofluorescenceSample Tested: Human fibroblast and human neural stem cellsSpecies: HumanVerified Customer | Posted 05/10/2017
-
Application: Western BlotSample Tested: Cortical neuronsSpecies: MouseVerified Customer | Posted 04/23/2017
-
Application: Immunocytochemistry/ImmunofluorescenceSample Tested: Neural progenitor cellsSpecies: HumanVerified Customer | Posted 04/13/2017
-
Application: Western BlotSample Tested: See PMID 23158765Species: MouseVerified Customer | Posted 02/04/2015
-
Application: ImmunofluorescenceSample Tested: See PMID 19409493Species: MouseVerified Customer | Posted 02/04/2015
-
Application: ImmunofluorescenceSample Tested: See PMID 22985741Species: HumanVerified Customer | Posted 02/04/2015
-
Application: ImmunocytochemistrySample Tested: See PMID 20722977Species: MouseVerified Customer | Posted 02/04/2015
-
Application: Immunohistochemistry-FrozenSample Tested: See PMID 22120963Species: OtherVerified Customer | Posted 02/04/2015
-
Application: ImmunofluorescenceSample Tested: See PMID 23658023Species: HumanVerified Customer | Posted 02/04/2015
There are no reviews that match your criteria.
Protocols
Find general support by application which include: protocols, troubleshooting, illustrated assays, videos and webinars.
- 7-Amino Actinomycin D (7-AAD) Cell Viability Flow Cytometry Protocol
- Antigen Retrieval Protocol (PIER)
- Antigen Retrieval for Frozen Sections Protocol
- Appropriate Fixation of IHC/ICC Samples
- Cellular Response to Hypoxia Protocols
- Chromogenic IHC Staining of Formalin-Fixed Paraffin-Embedded (FFPE) Tissue Protocol
- Chromogenic Immunohistochemistry Staining of Frozen Tissue
- ClariTSA™ Fluorophore Kits
- Detection & Visualization of Antibody Binding
- Extracellular Membrane Flow Cytometry Protocol
- Flow Cytometry Protocol for Cell Surface Markers
- Flow Cytometry Protocol for Staining Membrane Associated Proteins
- Flow Cytometry Staining Protocols
- Flow Cytometry Troubleshooting Guide
- Fluorescent IHC Staining of Frozen Tissue Protocol
- Graphic Protocol for Heat-induced Epitope Retrieval
- Graphic Protocol for the Preparation and Fluorescent IHC Staining of Frozen Tissue Sections
- Graphic Protocol for the Preparation and Fluorescent IHC Staining of Paraffin-embedded Tissue Sections
- Graphic Protocol for the Preparation of Gelatin-coated Slides for Histological Tissue Sections
- ICC Cell Smear Protocol for Suspension Cells
- ICC Immunocytochemistry Protocol Videos
- ICC for Adherent Cells
- IHC Sample Preparation (Frozen sections vs Paraffin)
- Immunocytochemistry (ICC) Protocol
- Immunocytochemistry Troubleshooting
- Immunofluorescence of Organoids Embedded in Cultrex Basement Membrane Extract
- Immunofluorescent IHC Staining of Formalin-Fixed Paraffin-Embedded (FFPE) Tissue Protocol
- Immunohistochemistry (IHC) and Immunocytochemistry (ICC) Protocols
- Immunohistochemistry Frozen Troubleshooting
- Immunohistochemistry Paraffin Troubleshooting
- Intracellular Flow Cytometry Protocol Using Alcohol (Methanol)
- Intracellular Flow Cytometry Protocol Using Detergents
- Intracellular Nuclear Staining Flow Cytometry Protocol Using Detergents
- Intracellular Staining Flow Cytometry Protocol Using Alcohol Permeabilization
- Intracellular Staining Flow Cytometry Protocol Using Detergents to Permeabilize Cells
- Preparing Samples for IHC/ICC Experiments
- Preventing Non-Specific Staining (Non-Specific Binding)
- Primary Antibody Selection & Optimization
- Propidium Iodide Cell Viability Flow Cytometry Protocol
- Protocol for Heat-Induced Epitope Retrieval (HIER)
- Protocol for Liperfluo
- Protocol for Making a 4% Formaldehyde Solution in PBS
- Protocol for VisUCyte™ HRP Polymer Detection Reagent
- Protocol for the Characterization of Human Th22 Cells
- Protocol for the Characterization of Human Th9 Cells
- Protocol for the Fluorescent ICC Staining of Cell Smears - Graphic
- Protocol for the Fluorescent ICC Staining of Cultured Cells on Coverslips - Graphic
- Protocol for the Preparation & Fixation of Cells on Coverslips
- Protocol for the Preparation and Chromogenic IHC Staining of Frozen Tissue Sections
- Protocol for the Preparation and Chromogenic IHC Staining of Frozen Tissue Sections - Graphic
- Protocol for the Preparation and Chromogenic IHC Staining of Paraffin-embedded Tissue Sections
- Protocol for the Preparation and Chromogenic IHC Staining of Paraffin-embedded Tissue Sections - Graphic
- Protocol for the Preparation and Fluorescent ICC Staining of Cells on Coverslips
- Protocol for the Preparation and Fluorescent ICC Staining of Non-adherent Cells
- Protocol for the Preparation and Fluorescent ICC Staining of Stem Cells on Coverslips
- Protocol for the Preparation and Fluorescent IHC Staining of Frozen Tissue Sections
- Protocol for the Preparation and Fluorescent IHC Staining of Paraffin-embedded Tissue Sections
- Protocol for the Preparation of Gelatin-coated Slides for Histological Tissue Sections
- Protocol for the Preparation of a Cell Smear for Non-adherent Cell ICC - Graphic
- Protocol: Annexin V and PI Staining by Flow Cytometry
- Protocol: Annexin V and PI Staining for Apoptosis by Flow Cytometry
- R&D Systems Quality Control Western Blot Protocol
- TUNEL and Active Caspase-3 Detection by IHC/ICC Protocol
- The Importance of IHC/ICC Controls
- Troubleshooting Guide: Fluorokine Flow Cytometry Kits
- Troubleshooting Guide: Immunohistochemistry
- Troubleshooting Guide: Western Blot Figures
- Western Blot Conditions
- Western Blot Protocol
- Western Blot Protocol for Cell Lysates
- Western Blot Troubleshooting
- Western Blot Troubleshooting Guide
- View all Protocols, Troubleshooting, Illustrated assays and Webinars
Loading...