IL-6 Antibody (6708)
R&D Systems | Catalog # MAB206

Key Product Details
Validated by
Species Reactivity
Validated:
Cited:
Applications
Validated:
Cited:
Label
Antibody Source
Product Specifications
Immunogen
Specificity
Clonality
Host
Isotype
Endotoxin Level
Scientific Data Images for IL-6 Antibody (6708)
Detection of Recombinant Human IL‑6 by Western Blot.
Western blot shows 25 ng of Recombinant Human IL-6 (Catalog # 206-IL), Recombinant Mouse IL-6 (Catalog # 406-ML) and Recombinant Rat IL-6 (Catalog # 506-RL). PVDF Membrane was probed with 1 µg/mL of Mouse Anti-Human/ Primate IL-6 Monoclonal Antibody (Catalog # MAB206) followed by HRP-conjugated Anti-Mouse IgG Secondary Antibody (Catalog # HAF007). A specific band was detected for IL-6 at approximately 18 kDa (as indicated). This experiment was conducted under reducing conditions and using Immunoblot Buffer Group 3.
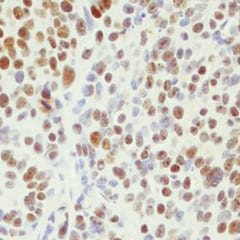
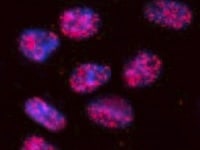
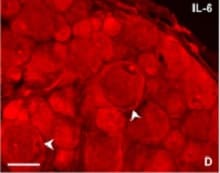
IL‑6 in Human Skin.
IL-6 was detected in immersion fixed frozen sections of hyperplastic human skin using Mouse Anti-Human/Primate IL-6 Monoclonal Antibody (Catalog # MAB206) at 8 µg/mL overnight at 4 °C. Tissue was stained using the NorthernLights™ 557-conjugated Anti-Mouse IgG Secondary Antibody (red; Catalog # NL007) and counterstained with DAPI (blue). Specific staining was localized to cytoplasm. View our protocol for Fluorescent IHC Staining of Frozen Tissue Sections.
Cell Proliferation Induced by IL‑6 and Neutralization by Human IL‑6 Antibody.
Recombinant Human IL-6 (Catalog # 206-IL) stimulates proliferation in the T1165.85.2.1 mouse plasmacytoma cell line in a dose-dependent manner (orange line). Proliferation elicited by Recombinant Human IL-6 (2.5 ng/mL) is neutralized (green line) by increasing concentrations of Mouse Anti-Human/Primate IL-6 Monoclonal Antibody (Catalog # MAB206). The ND50 is typically 8.00 - 80.0 ng/mL.
Detection of Human IL-6 by Immunohistochemistry
The role of IL‐6 signaling in the upregulation of PD‐L1 and downregulation of NKG2D ligands in CRPC cells. (A) PD‐L1 level in C4‐2siIL‐6/sc and CWRsiIL‐6/sc cell lines (left panel, mRNA level; right panel, protein level). (B) PD‐L1 IHC staining of tumor tissues. Error bars and significance values were obtained by counting positively stained cells in one randomly chosen phase of slides of three different stains. Magnification, 20× (inlet, 100×). (C) Blocking of IL‐6 Ab by neutralizing Ab of IL‐6 and the effect on PD‐L1 level in C4‐2sc and CWRsc cells. Cells were treated with either IL‐6 Ab or control IgG, total RNA extracted, cDNA converted, and the expression of PD‐L1 was compared in qPCR analyses. (D) PD‐L1 level in parental C4‐2 and CWR22Rv1 cells upon the addition of rhIL‐6. Parental cells (C4‐2P and CWR22Rv1P) were treated with rhIL‐6 (20 ng·mL−1) and PD‐L1 mRNA level was analyzed. (E) IHC staining of CRPC patient tumor samples. Two sets of adjacent tumor tissues (both samples, CRPC stage, Gleason score 8, patient age 70, Ningbo hospital in China) were stained with IL‐6 and PD‐L1. Arrows indicate the area showing positive staining of two molecules. (F) NKG2D ligand levels in IL‐6‐expressing cells and in IL‐6‐knockdown cells. Levels of five NKG2D ligands in C4‐2siIL‐6/sc and CWRsiIL‐6/sc cells were analyzed in qPCR analyses. (G) NKG2D ligand levels in parental C4‐2 and CWR22Rv1 cells upon the addition of rhIL‐6. Parental cells (C4‐2P and CWR22Rv1P) were treated with rhIL‐6 (20 ng·mL−1) and the NKG2D ligand levels (mRNA) were analyzed. (H) Flow cytometric analyses of NKG2D and PD‐1 on NK cells. Left two panels, primary NK cells were stained with PE‐NKG2D or APC‐PD‐1 and positive staining was analyzed. Right two panels, flow cytometric analyses of PD‐1 on NK cells, after coculture with tumor cells (6 h of incubation). Primary NK cells were added into tumor cells (1 : 1 ratio, tumor cells/NK cells) and collected after 6 h of incubation. PD‐1 levels in the collected
Detection of Human IL-6 by Western Blot
Autocrine IL-6 activates STAT3 signalling in lung cancer cell-induced epidural ADSCs. a Epidural ADSCs were pre-treated with CM from lung cancer cells for 48 h, and pSTAT3 and STAT3 expression levels were detected by western blotting. Epidural ADSCs cultured in untreated medium served as a control. b The effects of lung cancer cell CM on epidural ADSC proliferation were evaluated using the CCK-8 assay. Epidural ADSCs were treated with CM from one of four lung cancer cell lines, and the optical density of both groups at 450 nm was analysed. Data from three separate experiments are shown. c Western blot analysis of pSTAT3 and STAT3 in epidural ADSCs treated with either 10 ng/mL recombinant IL-6, 10 ng/mL recombinant IL-11 or 50 ng/mL recombinant LIF in the presence or absence of either neutralizing antibodies or isotype controls. Loading control, actin. d Western blot analysis of pSTAT3 and alpha -SMA expression in epidural ADSCs treated with lung cancer cell CM in the presence or absence of neutralizing antibodies against IL-6, IL-11 or LIF. Loading control, actin. *P < 0.05; **P < 0.01; ***P < 0.001 Image collected and cropped by CiteAb from the following publication (https://pubmed.ncbi.nlm.nih.gov/31196220), licensed under a CC-BY license. Not internally tested by R&D Systems.
Detection of Human IL-6 by Western Blot
Activated ADSCs trigger the proliferation and invasion of lung cancer cells by regulating MMP2/9 expression and EMT. a The effects of activated ADSCs on lung cancer cell proliferation were evaluated using the CCK-8 assay. Four lung cancer cell lines were cultured in the presence of ADSC-CM or aADSC-CM, and the optical density at 450 nm was analysed. The cancer cells cultured alone in normal growth medium were used as negative controls. Data from three separate experiments are shown. b The number of lung cancer cells that migrated through 8-μm Transwell membrane pores was counted to determine the changes in the invasive capabilities in response to CM from epidural ADSCs or aADSCs. c MMP2/9, E-cadherin and vimentin expression levels in four lung cancer cell lines treated with ADSC-CM or aADSC-CM were examined by western blotting. Lung cancer cells cultured in an untreated medium served as controls. d Lung cancer cells were treated with neutralizing antibodies against IL-6, isotype controls and aADSC-CM. Lung cancer cell invasion was analysed using a Transwell assay. Lung cancer cells cultured with untreated medium served as negative controls. e Lung cancer cells were treated with neutralizing antibodies against IL-6, isotype controls and aADSC-CM. MMP2/9, E-cadherin and vimentin expression levels in four lung cancer cell lines were analysed using western blotting. Lung cancer cells cultured with untreated medium served as negative controls. ***P < 0.001 Image collected and cropped by CiteAb from the following publication (https://pubmed.ncbi.nlm.nih.gov/31196220), licensed under a CC-BY license. Not internally tested by R&D Systems.
Detection of Human Human/Primate IL-6 Antibody by Western Blot
Musashi-1 mitigated DDP-induced apoptosis via the IL-6/AKT regulatory loopA. Cells were pretreated with 50 μM of LY294002 or vehicle for 3 hours, followed by 50 μM DDP treatment for 24 hours. The culture media were collected and the concentrations of IL-6 was determined by ELISA. B. 05MG-FlagMSI1 cells were treated with/without 50 μM DDP for 24 hours in the absence or presence of recombinant IL-6 (10 ng/ml) or anti-IL-6 neutralizing antibody (0.1 μg/ml). The cell lysates were analyzed by Western blot. C-D. The bar diagrams represent the quantified ratio of p-AKT-308/AKT and p-AKT-473/AKT obtained by the Western blot in B. E. 05MG cells were treated with control (serum free medium, S.F.) or condition media from 05MG-FlagMSI1 cells (C.M.) in the presence or absence of 50 μM DDP, IL-6 (10 ng/ml), and anti-IL-6 antibody (0.1 μg/ml) for 24 hours. The cell lysates were analyzed by Western blot to assess the levels of p-AKT-308, p-AKT-473, and total AKT. F-G. The bar diagrams represent the quantified ratio of p-AKT-308/AKT and p-AKT-473/AKT obtained in E. H. 05MG cells were treated as described in E and analyzed by Western blot. I-J. The bar diagrams represent the quantified ratio of cleavage-caspase-3/actin and cleaved-PARP/actin obtained in H. Data represent the mean ± S.D. of two independent experiments performed in triplicate. * P<0.05 vs AKT or Actin. Image collected and cropped by CiteAb from the following publication (https://pubmed.ncbi.nlm.nih.gov/27285760), licensed under a CC-BY license. Not internally tested by R&D Systems.
Detection of IL-6 by Immunohistochemistry
circCUL2 regulates the phenotypic plasticity of CAFs and promote PDAC progression by IL6. A Gene Set Enrichment Analysis (GSEA) of affected signatures in fibroblasts (circCUL2 vs. control). B GSEA plots for inflammatory CAF (iCAF) signatures in circCUL2 overexpression NFs from control. C-D qRT–PCR analysis of iCAF markers (IL6, TNF-alpha and IL1 alpha ) and myCAF marker (Acta2 and Axin2) expression in circCUL2 overexpression NFs. E Flow cytometric analysis of PDGFR alpha and alpha -SMA expression in circCUL2 overexpression NFs. F-H. Representative cytokine arrays for circCUL2-overexpression NFs and control (n = 3). arrows indicate the cytokines with significant changes, which were further confirmed by qRT–PCR and ELISA. I-L EdU assay (I), colony formation (J), Scratch wound healing assays (K) and transwell assays (L) of PANC-1 cells treated with conditioned medium circCUL2-overexpression NFs or anti-IL6. Scale bar, 100 μm. M western blot analysis of STAT3 and p-STAT3 in PANC-1 cells. Data are expressed as the mean ± SD of three independent experiments. **p < 0.01 and ***p < 0.001 (two-tailed Student t-tests) Image collected and cropped by CiteAb from the following open publication (https://pubmed.ncbi.nlm.nih.gov/35189958), licensed under a CC-BY license. Not internally tested by R&D Systems.
Detection of IL-6 by Western Blot
circCUL2 regulates the phenotypic plasticity of CAFs and promote PDAC progression by IL6. A Gene Set Enrichment Analysis (GSEA) of affected signatures in fibroblasts (circCUL2 vs. control). B GSEA plots for inflammatory CAF (iCAF) signatures in circCUL2 overexpression NFs from control. C-D qRT–PCR analysis of iCAF markers (IL6, TNF-alpha and IL1 alpha ) and myCAF marker (Acta2 and Axin2) expression in circCUL2 overexpression NFs. E Flow cytometric analysis of PDGFR alpha and alpha -SMA expression in circCUL2 overexpression NFs. F-H. Representative cytokine arrays for circCUL2-overexpression NFs and control (n = 3). arrows indicate the cytokines with significant changes, which were further confirmed by qRT–PCR and ELISA. I-L EdU assay (I), colony formation (J), Scratch wound healing assays (K) and transwell assays (L) of PANC-1 cells treated with conditioned medium circCUL2-overexpression NFs or anti-IL6. Scale bar, 100 μm. M western blot analysis of STAT3 and p-STAT3 in PANC-1 cells. Data are expressed as the mean ± SD of three independent experiments. **p < 0.01 and ***p < 0.001 (two-tailed Student t-tests) Image collected and cropped by CiteAb from the following open publication (https://pubmed.ncbi.nlm.nih.gov/35189958), licensed under a CC-BY license. Not internally tested by R&D Systems.
Detection of IL-6 by Immunohistochemistry
circCUL2-overexpression NFs promote PDAC progression in vivo. A Representative Bioluminescence images, lung and HE staining of lung tissue of mice 4 weeks after tail vein injection of luc-PANC-1 cell treated with conditioned medium as indicated (n = 8 per group). Scale bar, 100 μm. B Relative luminescence intensity in each group. C Histogram analysis of the metastatic nodules number in per lung. D lung metastasis rate of each group (Chi-square test). E-F Representative bioluminescence images and histogram analysis of luminescence intensity in each at day 30 are shown (n = 6). G Abdominal metastasis rate was calculated for indicated group (Chi-square test). H Representative images of orthotopic model in each group on which autopsy was performed. Red arrow indicated primary tumor; S, spleen; T, primary tumor; M, metastasis. I Images of PDX from 2 patients in 5 mice. (J) Tumor growth curves of indicated group (n = 5). K qRT–PCR analysis of circCUL2 levels in PDX of mice before and after treatment. L Representative images of IHC for PDGFR alpha and IL6. Scale bar, 100 μm. Data are expressed as the mean ± SD. **p < 0.01 and ***p < 0.001 (two-tailed Student t-tests) Image collected and cropped by CiteAb from the following open publication (https://pubmed.ncbi.nlm.nih.gov/35189958), licensed under a CC-BY license. Not internally tested by R&D Systems.
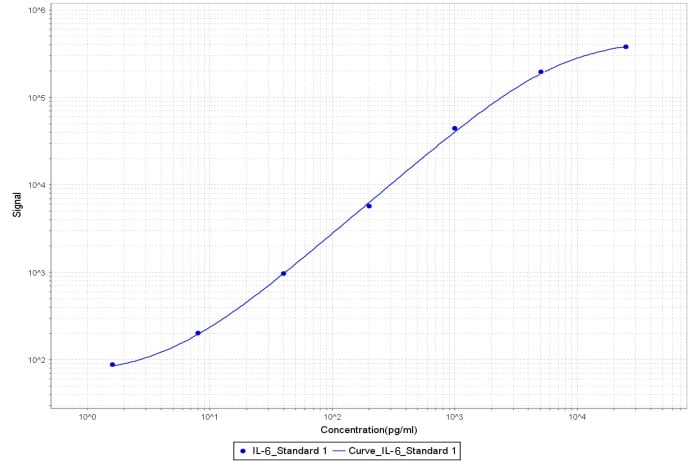
Human IL-6 ELISA Standard Curve
Recombinant Human IL‑6 (Catalog # 206-IL) was serially diluted and captured by Mouse Anti-Human/Primate IL‑6 Monoclonal Antibody (Catalog # MAB206) coated on a Clear Polystyrene Microplate (Catalog # DY990). Goat Anti-Human IL‑6 Antigen Affinity-purified Polyclonal Antibody (Catalog # AF-206-NA) was biotinylated and incubated with the protein captured on the plate. Detection of the standard curve was achieved by incubating Streptavidin-HRP (Catalog # DY998)Applications for IL-6 Antibody (6708)
Immunohistochemistry
Sample: Immersion fixed frozen sections of hyperplastic human skin
Western Blot
Sample: Recombinant Human IL‑6 (Catalog # 206-IL)
Neutralization
Human/Primate IL-6 Sandwich Immunoassay
Reviewed Applications
Read 16 reviews rated 4.5 using MAB206 in the following applications:
- Block/Neutralize (2 Reviews)
- ELISA (1 Review)
- Functional Assay (1 Review)
- Immunocytochemistry/Immunofluorescence (1 Review)
- Immunofluorescence (1 Review)
- Immunohistochemistry (2 Reviews)
- Immunohistochemistry-Frozen (1 Review)
- Immunohistochemistry-Paraffin (1 Review)
- Microarray (1 Review)
- Microarrays (2 Reviews)
- MSD assay (1 Review)
- Western Blot (2 Reviews)
Formulation, Preparation, and Storage
Purification
Reconstitution
Reconstitute at 0.5 mg/mL in sterile PBS. For liquid material, refer to CoA for concentration.
Formulation
Shipping
Stability & Storage
Calculators
Background: IL-6
Long Name
Alternate Names
Entrez Gene IDs
Gene Symbol
Additional IL-6 Products
Product Documents for IL-6 Antibody (6708)
Certificate of Analysis
To download a Certificate of Analysis, please enter a lot or batch number in the search box below.
Note: Certificate of Analysis not available for kit components.
Product Specific Notices for IL-6 Antibody (6708)
For research use only
Related Research Areas
Citations for IL-6 Antibody (6708)
 Powered by Bioz
Customer Reviews for IL-6 Antibody (6708) (16)
Have you used IL-6 Antibody (6708)?
Submit a review and receive an Amazon gift card!
$25/€18/£15/$25CAN/¥2500 Yen for a review with an image
$10/€7/£6/$10CAN/¥1110 Yen for a review without an image
Submit a review
Customer Images
-
Application: ImmunohistochemistrySample Tested: Colon tissueSpecies: HumanVerified Customer | Posted 03/17/2022

-
Application: Immunohistochemistry-FrozenSample Tested: Skin tissueSpecies: HumanVerified Customer | Posted 01/21/2022IL-6 in human skinIL‑6 was detected in immersion fixed frozen sections at 8 ug/ml overnight at 4C.
-
Application: ImmunofluorescenceSample Tested: Brain (dorsal root ganglia)Species: HumanVerified Customer | Posted 08/02/2021
-
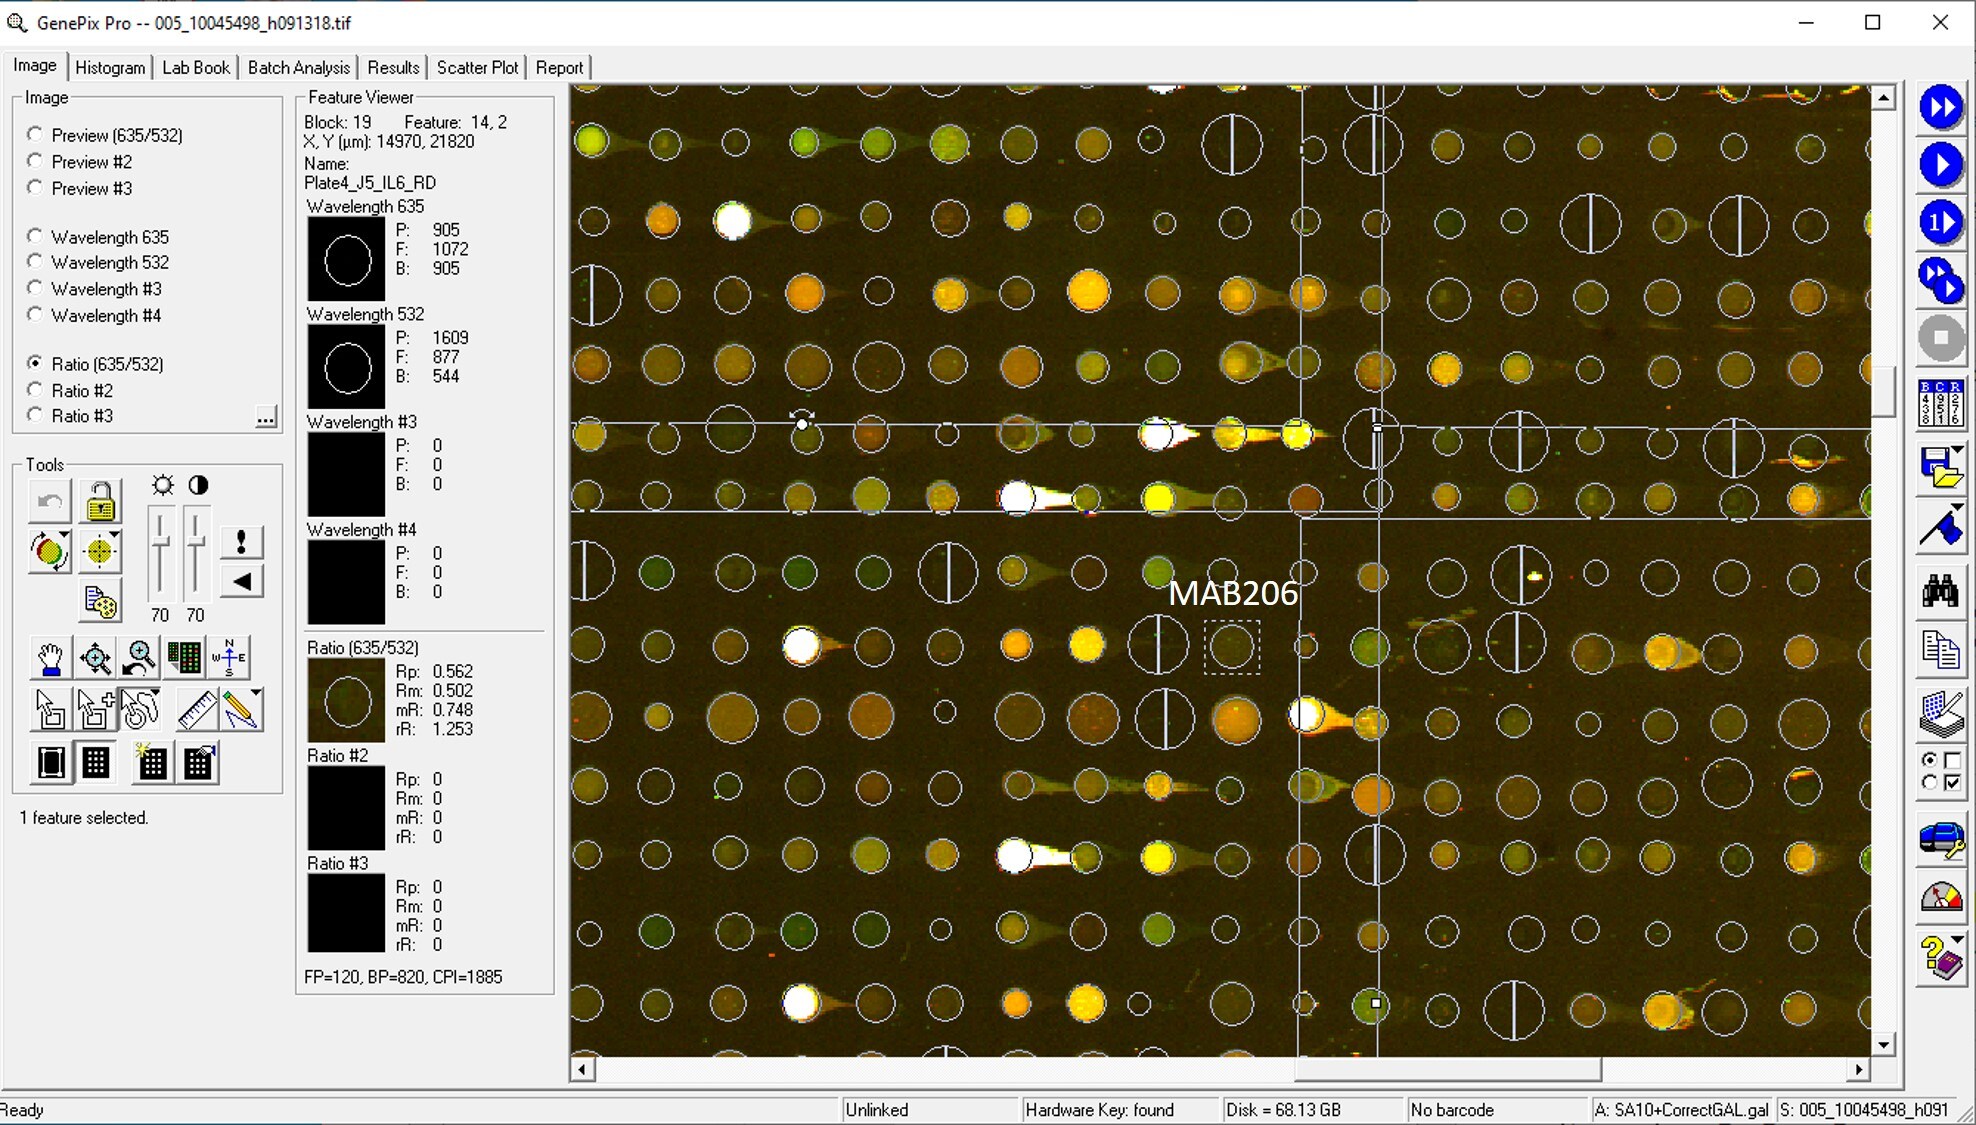
Application: MicroarraysSample Tested: EDTA PlasmaSpecies: HumanVerified Customer | Posted 06/10/2020
-
Application: Block/NeutralizeSample Tested: Serum-free Cell Culture Media and Breast cancer cellsSpecies: HumanVerified Customer | Posted 05/27/2019
-
Application: ELISASample Tested: EDTA PlasmaSpecies: HumanVerified Customer | Posted 12/19/2018
-
Application: MicroarraySample Tested: EDTA PlasmaSpecies: HumanVerified Customer | Posted 11/20/2018
-
Application: MicroarraysSample Tested: EDTA PlasmaSpecies: HumanVerified Customer | Posted 11/07/2018
-
Application: MSD assaySample Tested: Vitreous humorSpecies: Cynomolgus MonkeyVerified Customer | Posted 11/01/2018After biotinylation, used as a capture reagent according to the manufacturer’s protocol (Meso Scale Diagnostics LLC). Paired with goat PC IL-6 antibody (AF-206-NA) as a detection antibody. A standard curve with recombinant human IL-6 (Cat# 206-IL/CF) is shown (1.6-25,000 pg/ml).
-
Application: ImmunohistochemistrySample Tested: Spleen tissueSpecies: HumanVerified Customer | Posted 04/24/2018
-
Application: Western BlotSample Tested: Tumor cell lyastesSpecies: HumanVerified Customer | Posted 04/13/2018
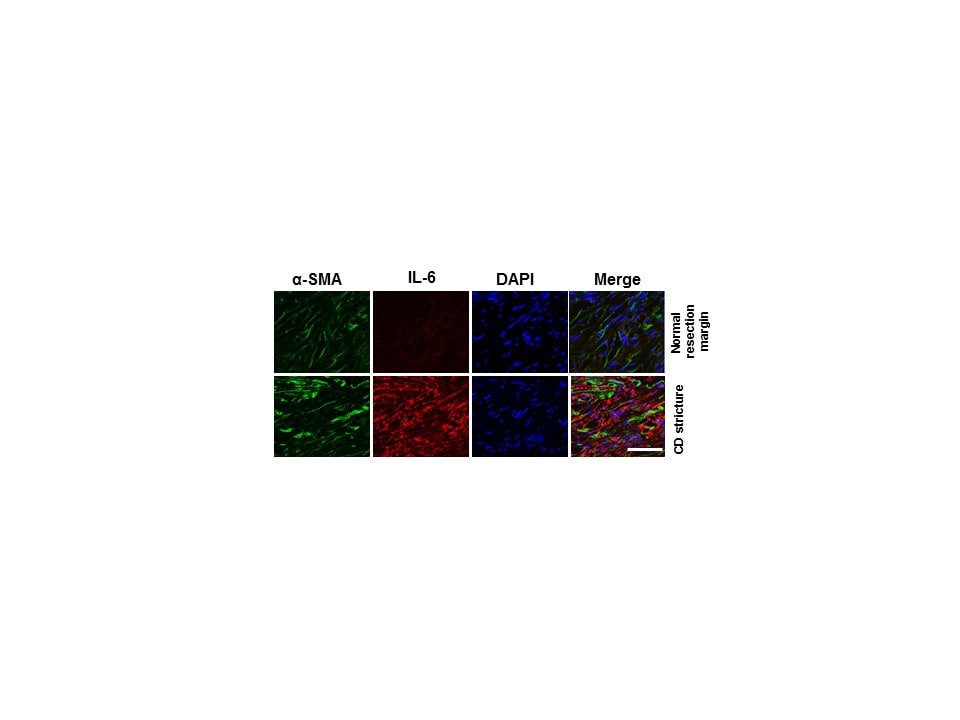
-
Application: Immunocytochemistry/ImmunofluorescenceSample Tested: Human affected ileum tissue from Crohn's patientsSpecies: Human ileum tissue and Human normal resection margin tissue from Crohn's patientsVerified Customer | Posted 03/30/2018Li C, Iness A, Yoon J, Grider JR, Murthy KS, Kellum JM, Kuemmerle JF. Increased autocrine IL-6 and STAT3 (Ser727) phosphorylation is profibrotic regulating TGF-beta 1 and Collagen I in muscle of stricturing Crohn's disease. J Immunol. 194(7):3422-31; 2015
-
Application: Western BlotSample Tested: Human recombinant test antibodySpecies: HumanVerified Customer | Posted 03/23/2018
-
Application: Functional AssaySample Tested: Kidney cancer cellsSpecies: HumanVerified Customer | Posted 05/16/2017
-
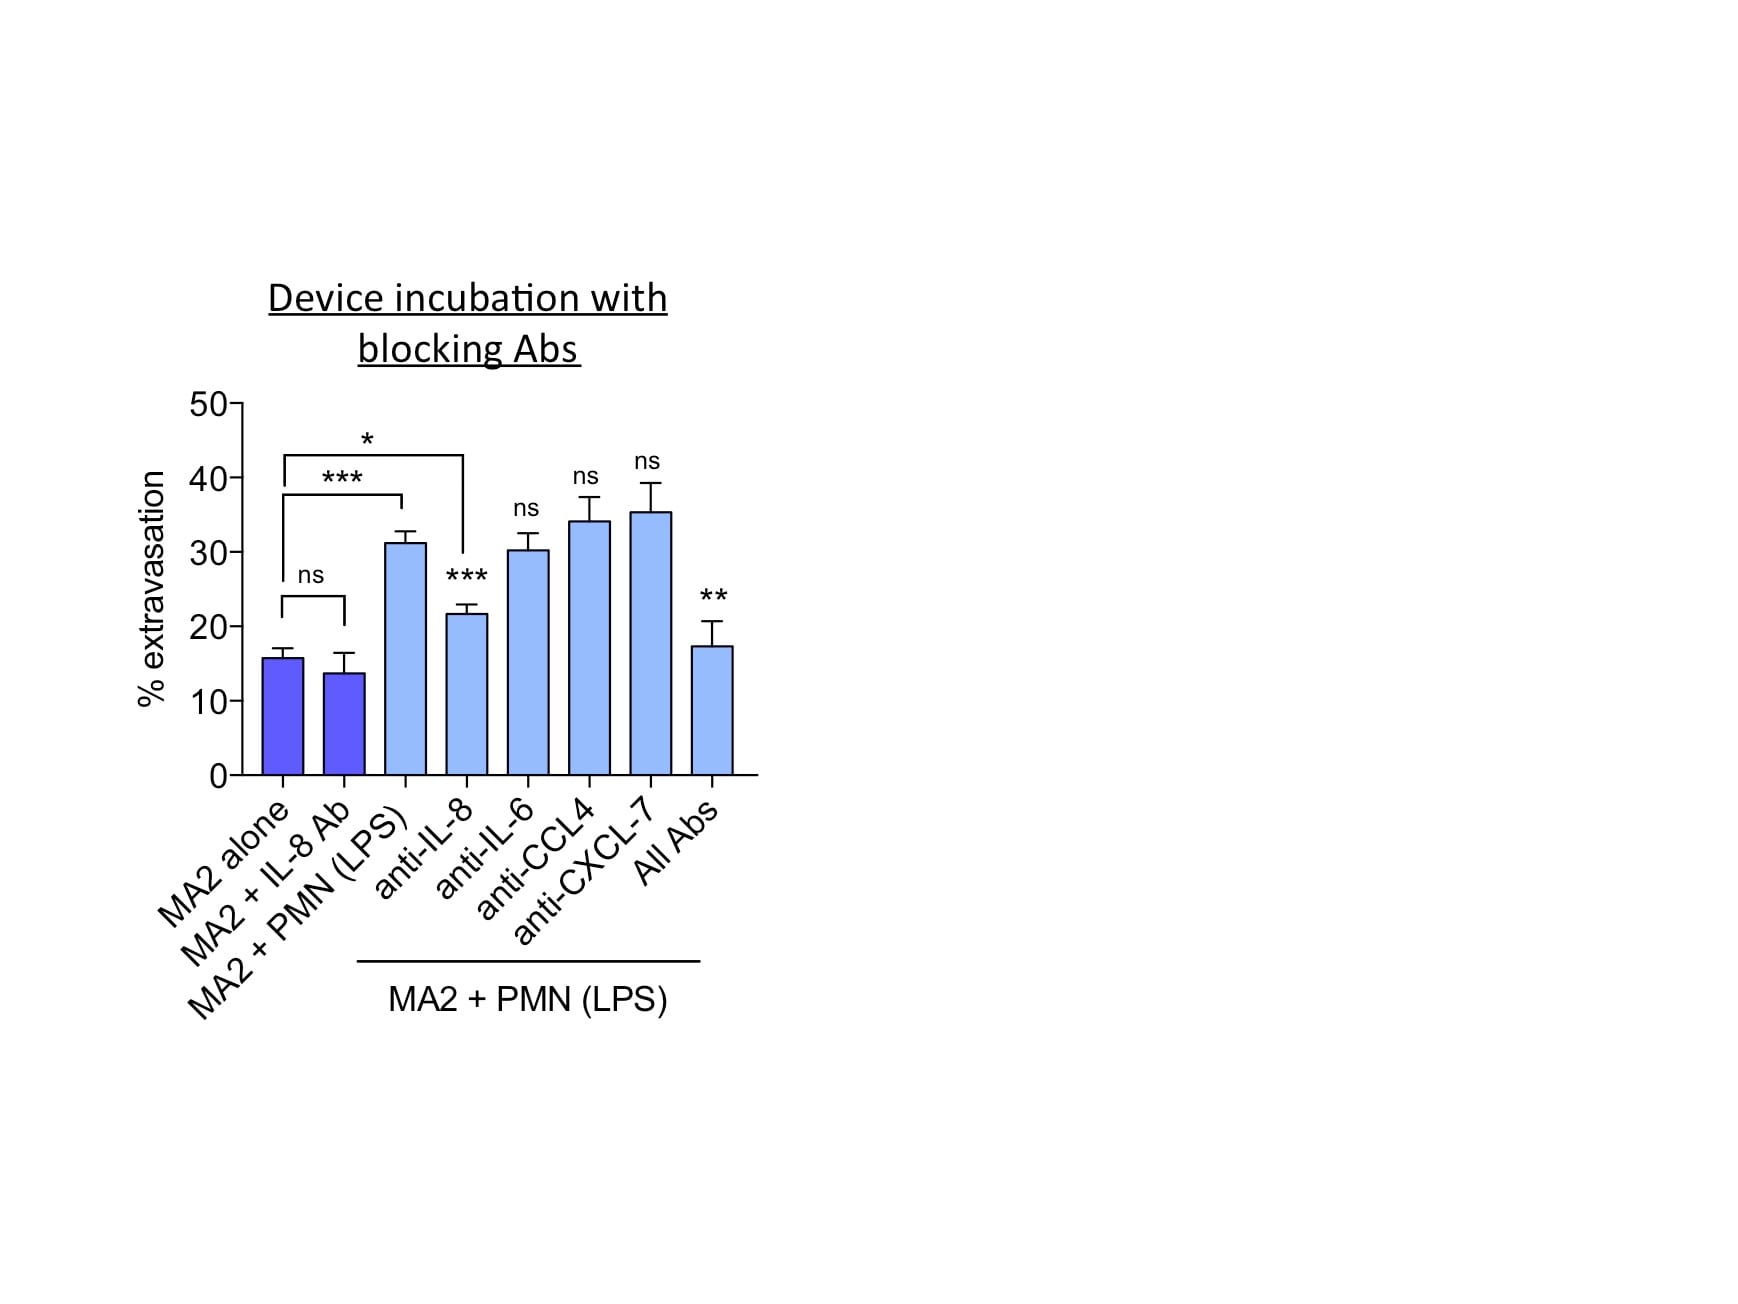
Application: Block/NeutralizeSample Tested: NeutrophilsSpecies: HumanVerified Customer | Posted 04/26/2017IL-6 secretion was neutralized in neutrophils and its effect on tumor cell extravasation was assessed.
-
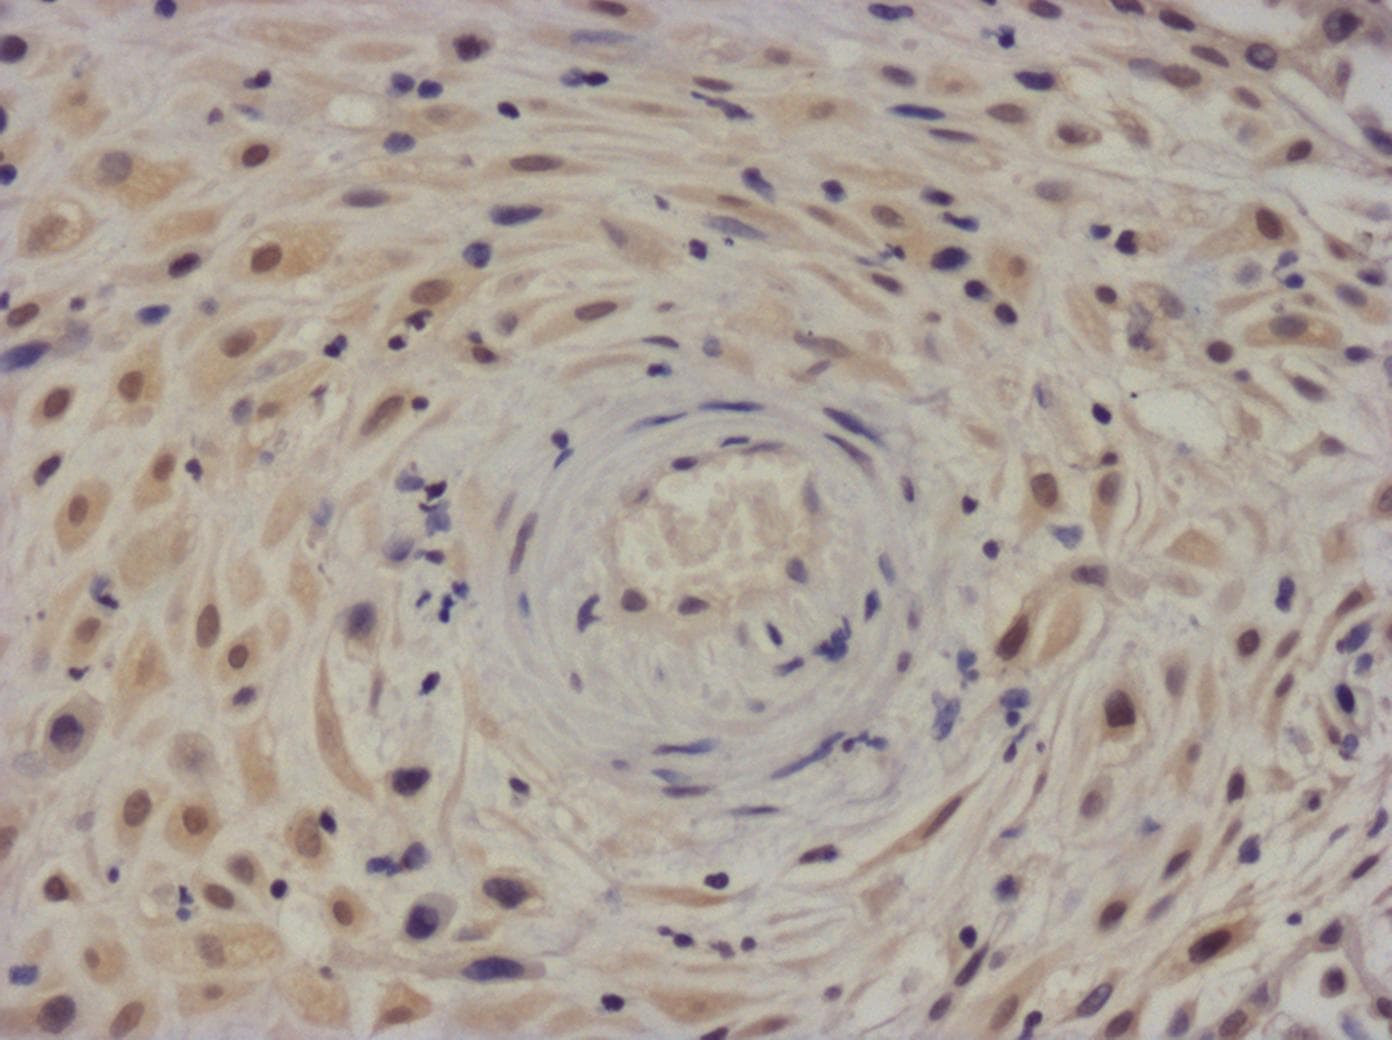
Application: Immunohistochemistry-ParaffinSample Tested: First trimester human deciduaSpecies: HumanVerified Customer | Posted 03/16/201720X magnification. IL-6 expressed in decidual stromal cells, although absent in smooth muscle cells of Spiral artery.Sodium Citrate antigen retrieval
There are no reviews that match your criteria.
Protocols
Find general support by application which include: protocols, troubleshooting, illustrated assays, videos and webinars.
- Antigen Retrieval Protocol (PIER)
- Antigen Retrieval for Frozen Sections Protocol
- Appropriate Fixation of IHC/ICC Samples
- Cellular Response to Hypoxia Protocols
- Chromogenic IHC Staining of Formalin-Fixed Paraffin-Embedded (FFPE) Tissue Protocol
- Chromogenic Immunohistochemistry Staining of Frozen Tissue
- ClariTSA™ Fluorophore Kits
- Detection & Visualization of Antibody Binding
- Fluorescent IHC Staining of Frozen Tissue Protocol
- Graphic Protocol for Heat-induced Epitope Retrieval
- Graphic Protocol for the Preparation and Fluorescent IHC Staining of Frozen Tissue Sections
- Graphic Protocol for the Preparation and Fluorescent IHC Staining of Paraffin-embedded Tissue Sections
- Graphic Protocol for the Preparation of Gelatin-coated Slides for Histological Tissue Sections
- IHC Sample Preparation (Frozen sections vs Paraffin)
- Immunofluorescent IHC Staining of Formalin-Fixed Paraffin-Embedded (FFPE) Tissue Protocol
- Immunohistochemistry (IHC) and Immunocytochemistry (ICC) Protocols
- Immunohistochemistry Frozen Troubleshooting
- Immunohistochemistry Paraffin Troubleshooting
- Preparing Samples for IHC/ICC Experiments
- Preventing Non-Specific Staining (Non-Specific Binding)
- Primary Antibody Selection & Optimization
- Protocol for Heat-Induced Epitope Retrieval (HIER)
- Protocol for Making a 4% Formaldehyde Solution in PBS
- Protocol for VisUCyte™ HRP Polymer Detection Reagent
- Protocol for the Preparation & Fixation of Cells on Coverslips
- Protocol for the Preparation and Chromogenic IHC Staining of Frozen Tissue Sections
- Protocol for the Preparation and Chromogenic IHC Staining of Frozen Tissue Sections - Graphic
- Protocol for the Preparation and Chromogenic IHC Staining of Paraffin-embedded Tissue Sections
- Protocol for the Preparation and Chromogenic IHC Staining of Paraffin-embedded Tissue Sections - Graphic
- Protocol for the Preparation and Fluorescent IHC Staining of Frozen Tissue Sections
- Protocol for the Preparation and Fluorescent IHC Staining of Paraffin-embedded Tissue Sections
- Protocol for the Preparation of Gelatin-coated Slides for Histological Tissue Sections
- R&D Systems Quality Control Western Blot Protocol
- TUNEL and Active Caspase-3 Detection by IHC/ICC Protocol
- The Importance of IHC/ICC Controls
- Troubleshooting Guide: Immunohistochemistry
- Troubleshooting Guide: Western Blot Figures
- Western Blot Conditions
- Western Blot Protocol
- Western Blot Protocol for Cell Lysates
- Western Blot Troubleshooting
- Western Blot Troubleshooting Guide
- View all Protocols, Troubleshooting, Illustrated assays and Webinars
FAQs for IL-6 Antibody (6708)
-
Q: What is the light chain of Human/Primate IL-6 Antibody, Catalog # MAB206, Clone # 6708?
A: Catalog # MAB206 has a kappa light chain.
-
Q: Which R&D Systems antibody product could be used as an isotype control for catalog # MAB206?
A: Catalog # MAB002 or MAB002R (Mouse IgG1 isotype control) could be used as a control for catalog # MAB206.
-
Q: What is the light chain of Human/Primate IL-6 Antibody, Catalog # MAB206, Clone # 6708?
A: Catalog # MAB206 has a kappa light chain.
-
Q: Which R&D Systems antibody product could be used as an isotype control for catalog # MAB206?
A: Catalog # MAB002 or MAB002R (Mouse IgG1 isotype control) could be used as a control for catalog # MAB206.
Associated Pathways