Human TNF-alpha Antibody (28401)
R&D Systems | Catalog # MAB610

Scientific images may be resized, cropped, or adjusted for brightness or contrast for presentation purposes. These updates are limited to presentation and do not affect the underlying scientific interpretation of the data. Where available, additional source data may be provided upon request.
Key Product Details
Species Reactivity
Validated:
Cited:
Applications
Validated:
Cited:
Label
Antibody Source
Product Specifications
Immunogen
Gly57-Leu233 (predicted)
Accession # P01375
Specificity
Clonality
Host
Isotype
Endotoxin Level
Scientific Data Images for Human TNF-alpha Antibody (28401)
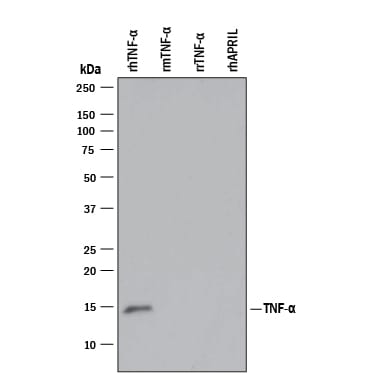
Detection of Recombinant Human TNF‑ alpha by Western Blot.
Western blot shows 25 ng of Recombinant Human TNF-a (Catalog # 210-TA), Recombinant Mouse TNF-a aa 80-235 (Catalog # 410-MT), Recombinant Rat TNF-a (Catalog # 510-RT), and Recombinant Human APRIL/TNFSF13 (Catalog # 5860-AP). PVDF Membrane was probed with 1 µg/mL of Mouse Anti-Human TNF-a Monoclonal Antibody (Catalog # MAB610) followed by HRP-conjugated Anti-Mouse IgG Secondary Antibody (Catalog # HAF007). A specific band was detected for TNF-a at approximately 15 kDa (as indicated). This experiment was conducted under reducing conditions and using Immunoblot Buffer Group 3.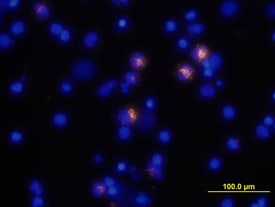
TNF‑ alpha in Human PBMCs.
TNF-a was detected in immersion fixed human peripheral blood mononuclear cells (PBMCs) stimulated with LPS and monensin using Mouse Anti-Human TNF-a Monoclonal Antibody (Catalog # MAB610) at 10 µg/mL for 3 hours at room temperature. Cells were stained using the NorthernLights™ 557-conjugated Anti-Mouse IgG Secondary Antibody (yellow; Catalog # NL007) and counterstained with DAPI (blue). View our protocol for Fluorescent ICC Staining of Non-adherent Cells.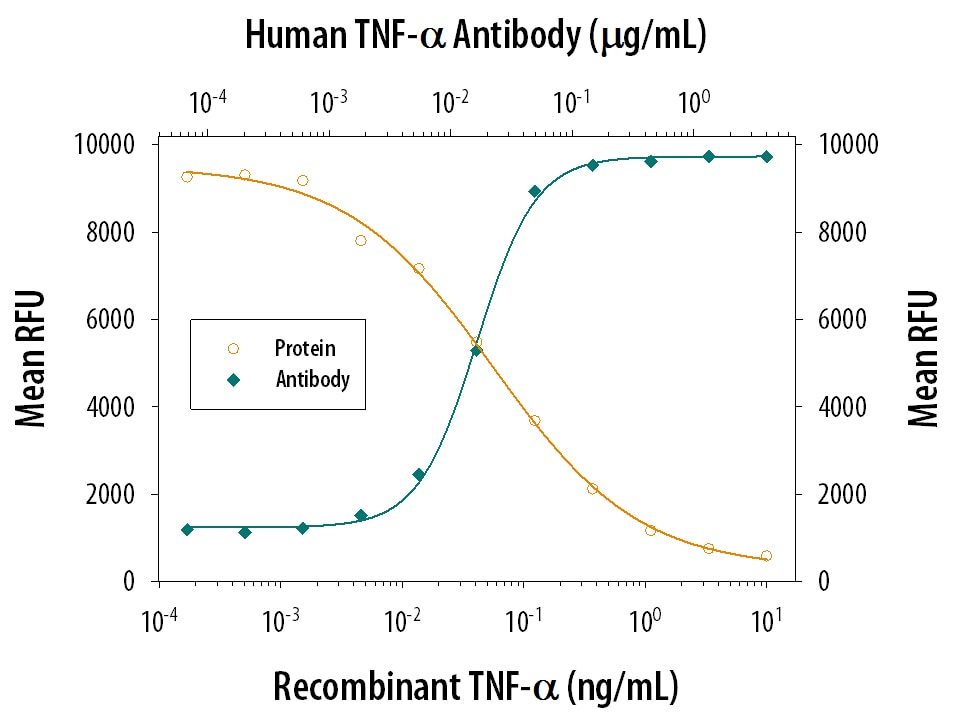
Cytotoxicity Induced by TNF‑ alpha and Neutralization by Human TNF‑ alpha Antibody.
Recombinant Human TNF-a (Catalog # 210-TA) induces cytotoxicity in the the L-929 mouse fibroblast cell line in a dose-dependent manner (orange line). Cytotoxicity elicited by Recombinant Human TNF-a (0.25 ng/mL) is neutral-ized (green line) by increasing concentrations of Mouse Anti-Human TNF-a Monoclonal Antibody (Catalog # MAB610). The ND50 is typically 0.01-0.04 µg/mL in the presence of the metabolic inhibitor actinomycin D.
Human TNF-alpha ELISA Standard Curve
Human TNF-alpha was serially diluted and captured by Mouse Anti-Human TNF‑ alpha Monoclonal Antibody (Catalog # MAB610) coated on a Clear Polystyrene Microplate (Catalog # DY990). Goat Anti-Human TNF‑ alpha Antigen Affinity-purified Polyclonal Antibody (Catalog # AF-210-NA) was biotinylated and incubated with the protein captured on the plate. Detection of the standard curve was achieved by incubating Streptavidin-HRP (Catalog # DY998)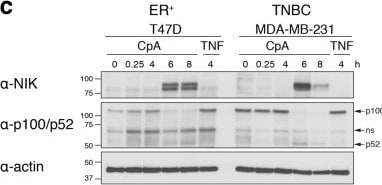
Detection of TNF-alpha by Western Blot
Differential expression of cIAP1/2 in ER+ and TNBC tumors.a Western blot analysis of cIAP1, cIAP2, and XIAP protein expression in the indicated ER+ and TNBC PDX models. For each PDX, two lysates from independent mice are represented. b Western blot analysis of cIAP1 and cIAP2 protein expression in lysates from ER+ PDX-23 and TNBC PDX-110 cell suspensions treated with 1 μM of birinapant for 2 h. c Western blot analysis of NIK, p100/p52 protein expression in indicated breast cancer cell lines treated at indicated times with 1 μM of CompA (CpA) or with 100 ng/ml of TNF. d Levels of cIAP2 transcripts relative to GAPDH transcripts in indicated breast cancer cell lines treated with 1 μM of CompA (CpA) for 24 h or 48 h or with 100 ng/ml of TNF for 24 h. The caspase inhibitor IDN-6556 (5 μM) was added in all conditions to inhibit cell death. Bars represent mean ± SD of duplicates of one representative experiment. e Western blot analysis of cleaved caspase-3 (CC3), cleaved caspase-8 (CC8) and PARP in lysates from indicated breast cancer cell lines treated with 1 μM of birinapant (bir) or CompA (CpA) for 24 h. Tubulin (a, b) and actin (c, e) were used as loading controls. Image collected and cropped by CiteAb from the following open publication (https://pubmed.ncbi.nlm.nih.gov/32341449), licensed under a CC-BY license. Not internally tested by R&D Systems.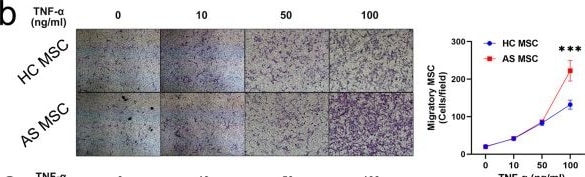
Detection of TNF-alpha by Immunohistochemistry
TNF-alpha induces enhanced directional migration of AS-MSC in vitro.a The number of stained migratory AS-MSC (n = 9) was larger than that of stained migratory HC-MSC (n = 9) when the MSC were cultured with macrophages (Mø; P = 1.2793E−10). The number of stained migratory HC-MSC with an anti-TNF-alpha neutralizing antibody (TNFi) (n = 9) were equal to that of stained migratory AS-MSC with TNFi (n = 9; P = 0.892). b The number of stained migratory AS-MSC (n = 9) was larger than that of stained migratory HC-MSC (n = 9) when the MSC were treated with 100 ng/ml TNF-alpha (P = 1.1836E−7). c The migratory area of MSC increased after TNF-alpha stimulation, and the migratory area of AS-MSC (n = 9) was larger than that of HC-MSC (n = 9) upon treatment with 100 ng/ml TNF-alpha (P = 1.4639E−9). d In a μ-slide chamber, the migration index (P = 0.00001), velocity (P = 0.002) and directionality (P = 0.000006) of AS-MSC (n = 9) toward TNF-alpha were all higher than those of HC-MSC (n = 9). The motion curve of AS-MSC toward TNF-alpha showed a stronger tendency than that of HC-MSC. Data were analyzed using two-tailed Student’s t-test. Values are presented as the mean ± SD. ** Indicates P < 0.01, and *** indicates P < 0.001. W/O TNF-alpha means without TNF-alpha. Image collected and cropped by CiteAb from the following open publication (https://www.nature.com/articles/s41467-021-25710-4), licensed under a CC-BY license. Not internally tested by R&D Systems.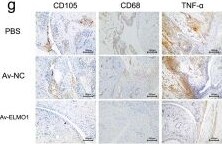
Detection of TNF-alpha by Immunohistochemistry
ELMO1 acts as a therapeutic target in AS.a ELMO1 expression, quantified by mean fluorescence intensity, was higher in CD105+ MSC at the enthesis site in AS patients (n = 9) than those at the enthesis site in non-AS patients (n = 9). P = 0.000123 based on two-tailed Student’s t-test. Scar bar = 20 μm. b The mean arthritis score of the AV-ELMO1 group (n = 5) was lower than that of the PBS (n = 5) and AV-NC (n = 5) groups from 4 to 8 weeks. P value shown in source data was based on one-way ANOVA followed by Bonferroni’s post hoc comparisons. c The incidence rate of the AV-ELMO1 (n = 5) group was lower than that of the PBS (n = 5) and AV-NC (n = 5) groups before week 7. d The degree of ankle swelling in the AV-ELMO1 group was much slighter compared to that in the PBS and AV-NC groups. e H&E staining showed that tissue lesions in the spine and ankles were much slighter in the AV-ELMO1 group than in the PBS and AV-NC groups. Experiment was repeated in five mice of each group independently. Scar bar = 100 μm. f Micro-CT scanning showed that osteophyte formation in the spine and ankles was much less in the AV-ELMO1 group than in the PBS and AV-NC groups. g The numbers of migratory CD105+ MSC, the numbers of CD68+ macrophages and expression of TNF-alpha in local tissues were less in the AV-ELMO1 group than in the PBS and AV-NC groups. Experiment was repeated in five mice of each group independently. Scar bar = 100 μm. PBS group indicates SKG treated with PBS. Av-NC group indicates SKG treated with control adenovirus. Av-ELMO1 group indicates SKG treated with adenovirus encoding an shRNA specific for ELMO1. Values are presented as the mean ± SD. ** Indicates P < 0.01, and *** indicates P < 0.001. Image collected and cropped by CiteAb from the following open publication (https://www.nature.com/articles/s41467-021-25710-4), licensed under a CC-BY license. Not internally tested by R&D Systems.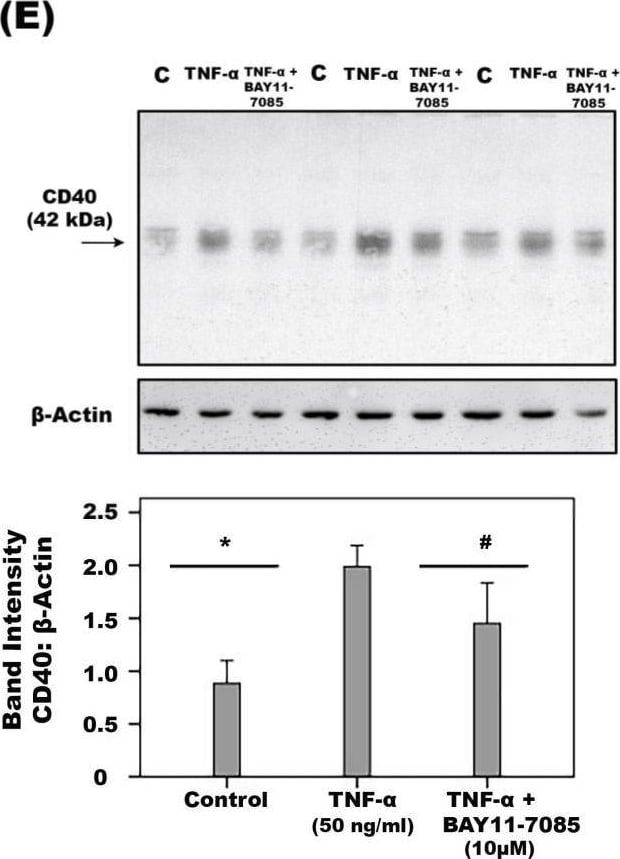
Detection of TNF-alpha by Western Blot
CD40 expression on human retinal microvascular endothelial cells (HRMECs) was evaluated through flow cytometry. Representative histogram of 4 independent experiments showing mean fluorescence intensity (MFI) of CD40 expression on HRMECs. CD40 expression on HRMECs stained with the primary mouse anti-human CD40 antibody and secondary goat anti-mouse AlexaFluor488 (blue) compared to cells incubated with the secondary antibody only (red) (A). HRMECs were left untreated (Control “C”) or treated with tumor necrosis factor-alpha (TNF-alpha ), vascular endothelial growth factor (VEGF), TNF-alpha plus a 1 h-pre-incubation with BAY11-7085 or VEGF plus a 1 h-pre-incubation with BAY11-7085 for 24 h. Protein expression levels of CD40 (B,D–F) and CD40L (C) in cell lysate were determined by Western blot analysis. Results are expressed as mean ± standard deviation from three different experiments. One-way ANOVA and independent t-test were used for comparisons between three groups and two groups, respectively. (* p < 0.05 compared with the values obtained from untreated cells. # p < 0.05 compared with TNF-alpha -or VEGF-treated cells). Image collected and cropped by CiteAb from the following open publication (https://pubmed.ncbi.nlm.nih.gov/37958563), licensed under a CC-BY license. Not internally tested by R&D Systems.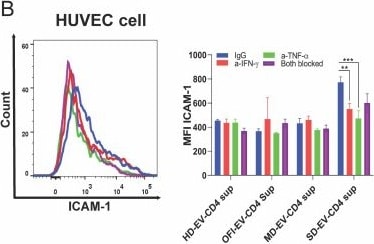
Detection of TNF-alpha by Flow Cytometry
TNF-alpha in SD-EV-modulated CD4+ T-cell supernatant critical for enhanced ICAM-1 expression and apoptosis in endothelial cells. SD-EV-modulated CD4+ T-cell supernatant was incubated with anti-IFN-gamma (0.03 µg/mL), TNF-alpha (0.04 µg/mL), or both to deplete the respective cytokines. The cytokine-depleted supernatant was added on EA.hy926 and HUVEC cells. Representative image of ICAM-1 expression on EA.hy926 (A) and HUVEC (B) after incubating with SD-EV-modulated CD4+ T-cell supernatant depleted for the cytokines. The right panel shows the MFI for ICAM-1 in different groups. ANOVA was used to calculate the significance. **P = 0.008. (C) Representative FACS images of EA.hy926 cells for apoptosis after incubating with indicated EV-modulated CD4+ T-cell supernatant. The right panel shows the combined graph of % Annexin positive EA.hy926 cells. Each dot represents one set of EV-modulated CD4+ T-cell supernatant. Student’s unpaired two-tailed t-test was used to calculate the significance (***P < 0.0001). (D) EA.hy926 cells were incubated with cytokine-depleted supernatant (IFN-gamma, TNF-alpha, or both) obtained from indicated EV-modulated CD4+ T cells. Representative FACS images of EA.hy926 cells for apoptosis. The right panel shows the combined graph of % Annexin positive EA.hy926 cells. Each dot represents one set of EV-modulated CD4+ T-cell supernatant. Student’s unpaired two-tailed t-tests were used to observe the significance (**** P < 0.0001, ns = 0.2977). Image collected and cropped by CiteAb from the following open publication (https://pubmed.ncbi.nlm.nih.gov/39745465), licensed under a CC-BY license. Not internally tested by R&D Systems.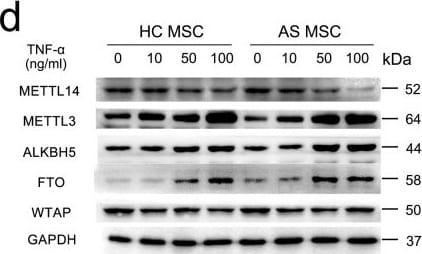
Detection of TNF-alpha by Western Blot
Decreasing METTL14 expression leads to lower m6A modification and RNA degradation of ELMO1 in TNF-alpha -treated AS-MSC.a The m6A modification level of ELMO1 decreased after 100 ng/ml TNF-alpha treatment, and the m6A level of ELMO1 in AS-MSC (n = 9) was lower than that in HC-MSC (n = 9; P = 0.000003) with 100 ng/ml TNF-alpha treatment. b The degeneration curves of ELMO1 mRNA for HC-MSC and AS-MSC treated with 100 ng/ml TNF-alpha. c The t1/2 of ELMO1 mRNA in AS-MSC (n = 9) was higher than that in HC-MSC (n = 9; P = 0.01) after 100 ng/ml TNF-alpha treatment. d, e The METTL14 expression in AS-MSC (n = 9) treated with 100 ng/ml TNF-alpha was lower than that in HC-MSC (n = 9; P = 0.000024). f The mean fluorescence intensity of MET was higher in CD105+ MSC at the enthesis site in AS patients (n = 9) than those at the enthesis site in non-AS patients (n = 9; P = 0.000002). Scar bar = 20 μm. Data were analyzed using two-tailed Student’s t-test. Values are presented as the mean ± SD. ** Indicates P < 0.01, and *** indicates P < 0.001. Image collected and cropped by CiteAb from the following open publication (https://www.nature.com/articles/s41467-021-25710-4), licensed under a CC-BY license. Not internally tested by R&D Systems.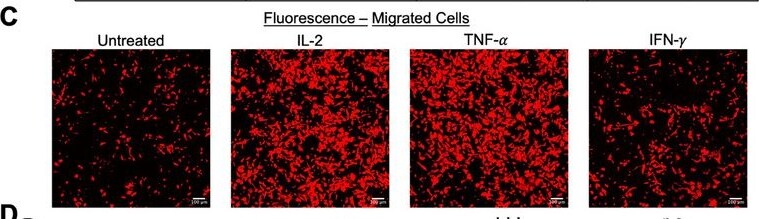
Detection of TNF-alpha by Immunohistochemistry
Impact of cytokines on metabolism and aggressiveness of SKOV3 cells. (A) TAG and TC NIR h2SRS imaging maps of SKOV3 cells with and without cytokines: IL‐2, TNF‐𝛼, IFN‐𝛾 supplemented media for SKOV3 cells, IL‐2 Concentration: 100 IU/mL, TNF‐𝛼 Concentration: 10 ng/mL, IFN‐𝛾 Concentration: 5ng/mL, scale bars: 10 µm. (B) Quantification of cellular TC and TAG in SKOV3 cells incubated with medium with and without cytokines supplementation, n>31 per group. (C) Confocal fluorescence imaging of migrated SKOV3 cells with and without cytokines, scale bars: 100 µm. (D) Quantification of the cell migration with and without Cytokines treatment, n = 3, ***p<0.001, **p<0.01, data presented as means +/± stdev, TC: total cholesterol. TAG: triglycerides/triacylglycerols. Image collected and cropped by CiteAb from the following open publication (https://pubmed.ncbi.nlm.nih.gov/41691468), licensed under a CC-BY license. Not internally tested by R&D Systems.Applications for Human TNF-alpha Antibody (28401)
Immunocytochemistry
Sample: Immersion fixed human peripheral blood mononuclear cells (PBMCs) stimulated with LPS and monensin
Western Blot
Sample: Recombinant Human TNF‑ alpha (Catalog # 210-TA)
Neutralization
Human TNF-alpha Sandwich Immunoassay
Reviewed Applications
Read 5 reviews rated 5 using MAB610 in the following applications:
Formulation, Preparation, and Storage
Purification
Reconstitution
Reconstitute at 0.5 mg/mL in sterile PBS. For liquid material, refer to CoA for concentration.
Formulation
Shipping
Stability & Storage
- 12 months from date of receipt, -20 to -70 °C as supplied.
- 1 month, 2 to 8 °C under sterile conditions after reconstitution.
- 6 months, -20 to -70 °C under sterile conditions after reconstitution.
Calculators
Background: TNF-alpha
Long Name
Alternate Names
Entrez Gene IDs
Gene Symbol
UniProt
Additional TNF-alpha Products
Product Documents for Human TNF-alpha Antibody (28401)
Certificate of Analysis
To download a Certificate of Analysis, please enter a lot or batch number in the search box below.
Note: Certificate of Analysis not available for kit components.
Product Specific Notices for Human TNF-alpha Antibody (28401)
For research use only
Related Research Areas
Citations for Human TNF-alpha Antibody (28401)
 Powered by Bioz
Customer Reviews for Human TNF-alpha Antibody (28401) (5)
Have you used Human TNF-alpha Antibody (28401)?
Submit a review and receive an Amazon gift card!
$25/€18/£15/$25CAN/¥2500 for a review with an image
$10/€7/£6/$10CAN/¥1110 for a review without an image
Submit a review
Customer Images
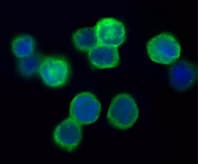
-
Application: Immunocytochemistry/ImmunofluorescenceSample Tested: macrophagesSpecies: HumanVerified Customer | Posted 06/16/2022

-
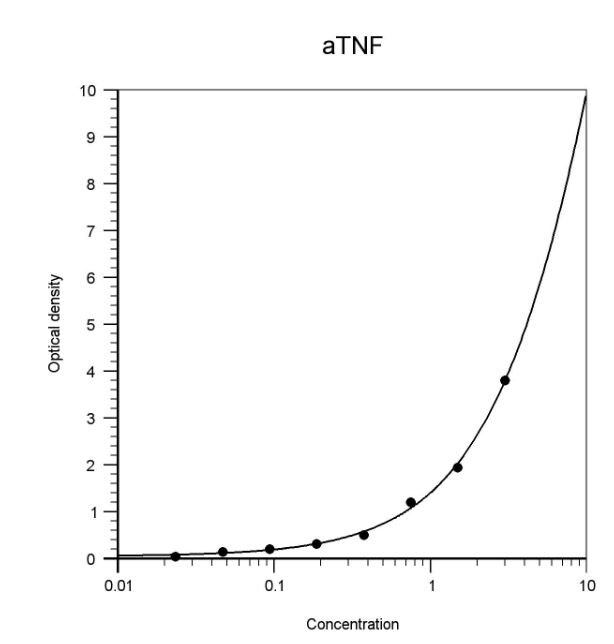
Application: ELISASample Tested: Heparin PlasmaSpecies: HumanVerified Customer | Posted 05/23/2019
-
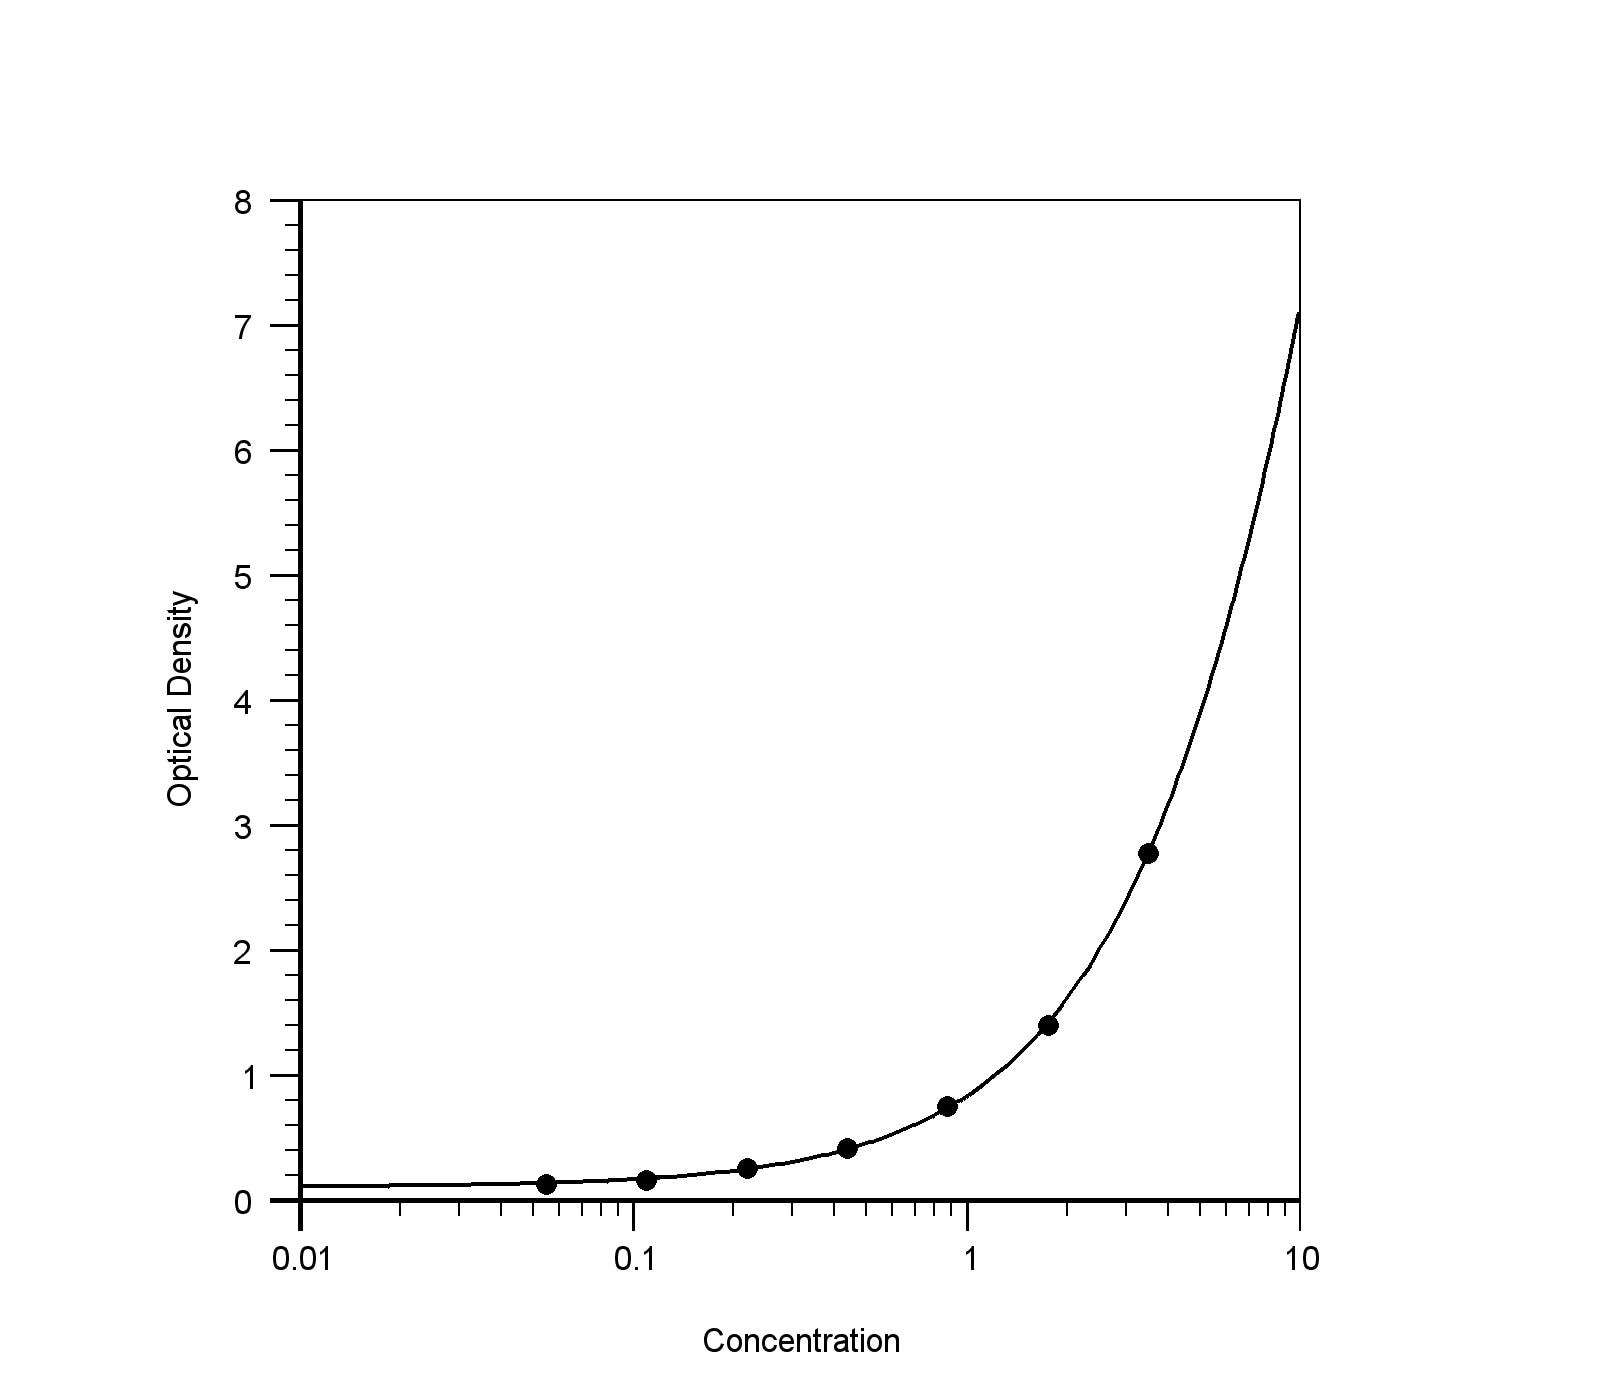
Application: ELISASample Tested: EDTA PlasmaSpecies: HumanVerified Customer | Posted 08/20/2018
-
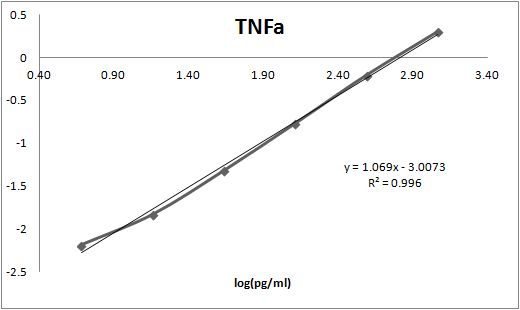
Application: ELISASample Tested: Serum and PlasmaSpecies: HumanVerified Customer | Posted 11/16/2017MAB610 was used as the capture antibody in an ELISA targeting TNFa in human samples. The antibody AF-210 was used as the detection.
-
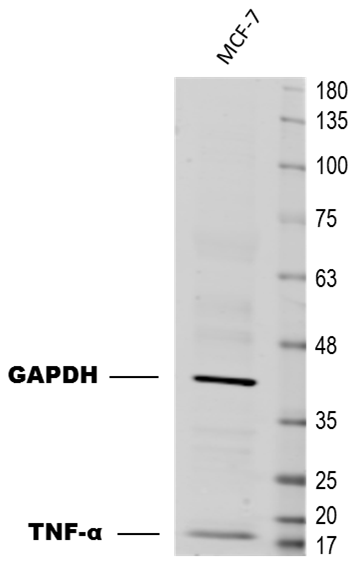
Application: Western BlotSample Tested: Human breast cancer cell lysate (MCF-7)Species: HumanVerified Customer | Posted 04/20/2017MCF-7 cell extract probed with 1 ug/mL of Mouse anti-Human TNF-alpha Antibody (#MAB610) showing a specific band at 18 kDa. Membrane blocked with 5%BSA in PBS. Buffer: 5% BSA in PBS. Secondary Ab: anti-Mouse IgG 1:5,000.
There are no reviews that match your criteria.
Protocols
Find general support by application which include: protocols, troubleshooting, illustrated assays, videos and webinars.
- Appropriate Fixation of IHC/ICC Samples
- Cellular Response to Hypoxia Protocols
- ClariTSA™ Fluorophore Kits
- Detection & Visualization of Antibody Binding
- ICC Cell Smear Protocol for Suspension Cells
- ICC Immunocytochemistry Protocol Videos
- ICC for Adherent Cells
- Immunocytochemistry (ICC) Protocol
- Immunocytochemistry Troubleshooting
- Immunofluorescence of Organoids Embedded in Cultrex Basement Membrane Extract
- Immunohistochemistry (IHC) and Immunocytochemistry (ICC) Protocols
- Preparing Samples for IHC/ICC Experiments
- Preventing Non-Specific Staining (Non-Specific Binding)
- Primary Antibody Selection & Optimization
- Protocol for VisUCyte™ HRP Polymer Detection Reagent
- Protocol for the Fluorescent ICC Staining of Cell Smears - Graphic
- Protocol for the Fluorescent ICC Staining of Cultured Cells on Coverslips - Graphic
- Protocol for the Preparation and Fluorescent ICC Staining of Cells on Coverslips
- Protocol for the Preparation and Fluorescent ICC Staining of Non-adherent Cells
- Protocol for the Preparation and Fluorescent ICC Staining of Stem Cells on Coverslips
- Protocol for the Preparation of a Cell Smear for Non-adherent Cell ICC - Graphic
- R&D Systems Quality Control Western Blot Protocol
- TUNEL and Active Caspase-3 Detection by IHC/ICC Protocol
- The Importance of IHC/ICC Controls
- Troubleshooting Guide: Western Blot Figures
- Western Blot Conditions
- Western Blot Protocol
- Western Blot Protocol for Cell Lysates
- Western Blot Troubleshooting
- Western Blot Troubleshooting Guide
- View all Protocols, Troubleshooting, Illustrated assays and Webinars
FAQs for Human TNF-alpha Antibody (28401)
-
Q: Can catalog # MAB610 neutralize mouse TNF-alpha?
A: MAB610 shows less than 0.05% cross-reactivity with recombinant mouse TNF-alpha and does not neutralize mouse TNF-alpha.
-
Q: What is the light chain of Human TNF-alpha Antibody, Catalog # MAB610, Clone # 28401?
A: Catalog # MAB610 has a kappa light chain.
-
Q: Can catalog # MAB610 neutralize mouse TNF-alpha?
A: MAB610 shows less than 0.05% cross-reactivity with recombinant mouse TNF-alpha and does not neutralize mouse TNF-alpha.
-
Q: What is the light chain of Human TNF-alpha Antibody, Catalog # MAB610, Clone # 28401?
A: Catalog # MAB610 has a kappa light chain.
Associated Pathways